What is a DEM (Digital Elevation Model)?
A Digital Elevation Model (DEM) is a raster grid — a regular matrix of cells — where each cell stores a single ground elevation value, like a photograph of the terrain where every pixel holds a height instead of a colour. It is one of the most important datasets in surveying, GIS and civil engineering: if you work with terrain at all, almost everything you compute starts from a DEM. This guide explains how a DEM is produced and what you can do with it.
The short definition
A DEM is a raster grid — a regular matrix of cells — where each cell stores a single ground elevation value. Think of it as a photograph of the terrain where, instead of a colour, every pixel holds a height above a reference datum.
Because the grid is regular and georeferenced, you can read the elevation at any location, and derive slope, drainage, contours, volumes and much more from it.
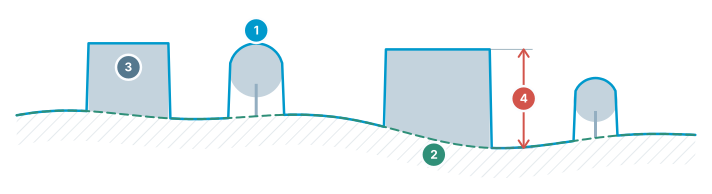
DEM / DSM / DTM
Three different surfaces of the same terrain — which one to use, at a glance.
- DSM — top surface — includes buildings, trees and structures
- DTM / DEM — bare earth — real ground with objects removed
- Objects — present in the DSM, absent in the DTM
- Difference = object height — building/tree height comes from this gap
How is a DEM made?
DEMs come from several sources: LiDAR point clouds, photogrammetry from aerial or drone imagery, radar and satellite data, or traditional survey. In each case the raw measurements are turned into a regular elevation grid.
Drone surveys are now a very common source: images are processed into a point cloud, and the ground points are gridded into a DEM covering the site at high resolution.
DEM vs DSM vs DTM
"DEM" is often used as a general term for an elevation grid. In practice it is useful to distinguish a DSM (Digital Surface Model), which includes buildings and vegetation, from a DTM (Digital Terrain Model), which is bare earth with objects removed.
Which one you want depends on the task: earthworks and drainage need the bare-earth DTM, while volumes of piles or line-of-sight work may need the surface DSM.
What can you do with a DEM?
A DEM is the base layer for a huge range of work: measuring distances and areas that follow the ground, computing cut/fill and stockpile volumes, cutting cross-sections, generating contour lines, and running slope, hydrology, viewshed and sun-and-shadow analysis.
The practical challenge is size. A modern DEM of a real site can be hundreds of megabytes or several gigabytes, which is why software that streams the data and computes on it efficiently matters.
Frequently asked questions
What is a DEM (Digital Elevation Model)?
A DEM is a raster grid — a regular matrix of cells — where each cell stores a single ground elevation value, like a photograph of the terrain where every pixel holds a height instead of a colour. Because it's georeferenced, you can read the elevation at any location and derive slope, drainage, contours, volumes and more from it.
What is the difference between DEM, DSM, and DTM?
DEM is often used as a general term for elevation grids, but DSM (Digital Surface Model) includes the top surface such as buildings and trees, while DTM (Digital Terrain Model) represents the bare earth. Earthworks and drainage need the bare-earth DTM, while volumes of piles or line-of-sight work may need the surface DSM.
How is a DEM created?
DEMs are produced from LiDAR point clouds, photogrammetry from aerial or drone imagery, radar and satellite data, or traditional survey, with the raw measurements converted into a regular elevation grid. Drone surveys are now a very common source, with imagery processed into point clouds that are then gridded into a high-resolution DEM.
What can you do with a DEM?
A DEM is the base layer for measuring distances and areas that follow the ground, computing cut/fill and stockpile volumes, cutting cross-sections, generating contour lines, and running slope, hydrology, viewshed, and sun-and-shadow analysis.
Sources
See how STREAM streams and analyzes large DEMs
Native Windows · fully offline · free beta