HYDROLOGY
Hydrology Software for Watershed & Drainage Analysis
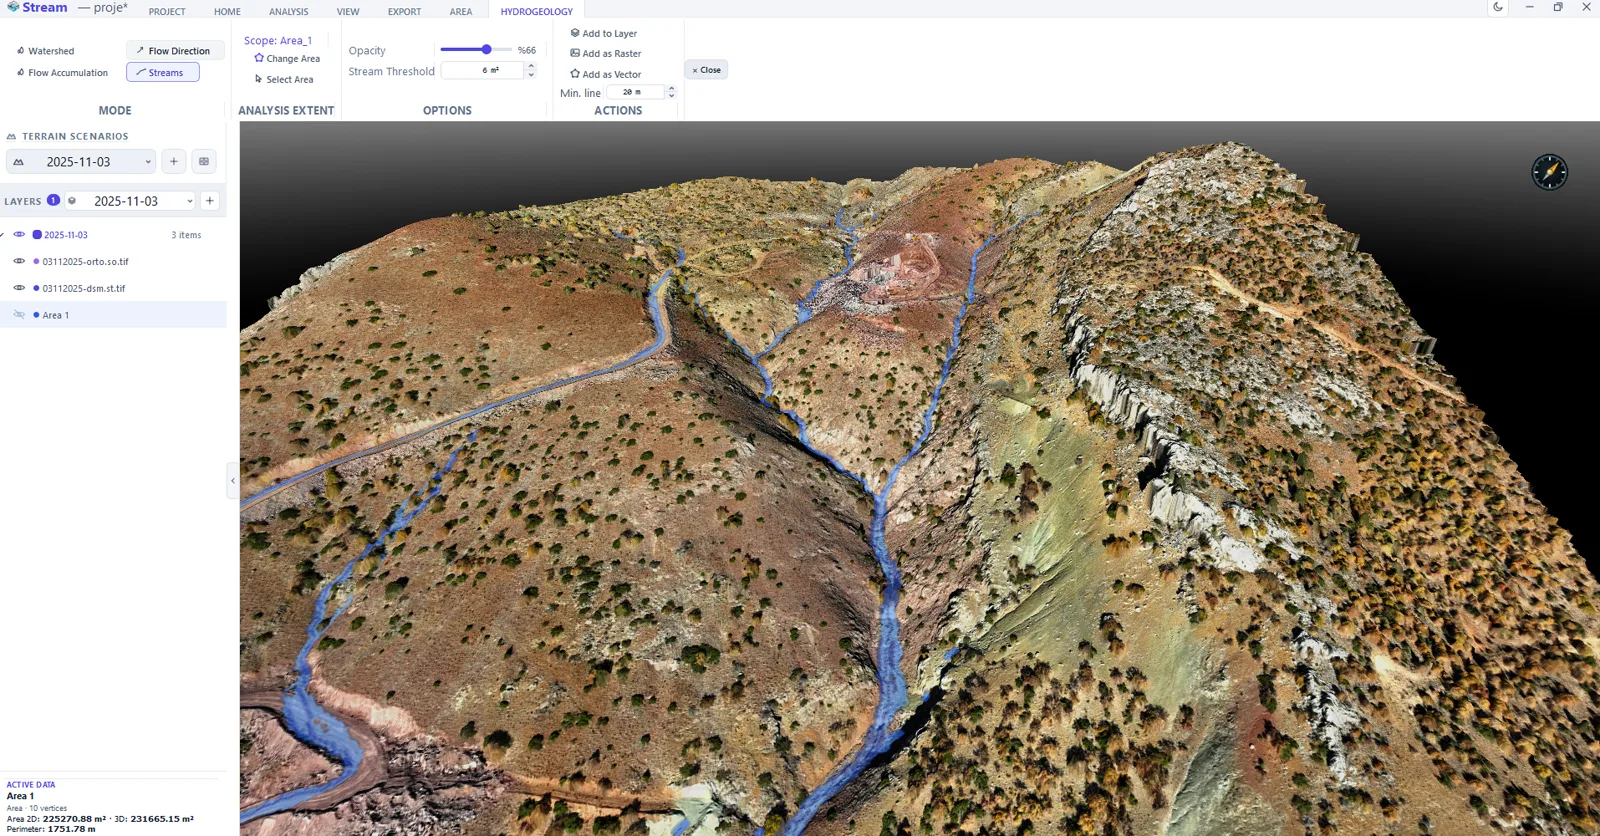
STREAM is hydrology software that models how water moves across your terrain, straight from the DEM. Compute flow direction and accumulation, extract stream networks, and delineate watersheds and basins — all as live layers over the surface.
What is terrain hydrology analysis?
Hydrology analysis derives how water flows across an elevation surface. Flow direction shows where each cell drains; flow accumulation shows where flow concentrates into channels; watershed delineation groups the area draining to a point.
It is fundamental for drainage design, flood and erosion studies, and catchment planning — all read from the DEM.
Most hydrology software treats flow direction, accumulation and watershed delineation as a module run on data imported from elsewhere. In STREAM these are native operations on the same DEM you already view, edit and export, with no import/export round-trip.
Hydrology Software in STREAM
Flow direction & accumulation
Compute where every cell drains and where flow concentrates into channels across the whole DEM.
Stream networks
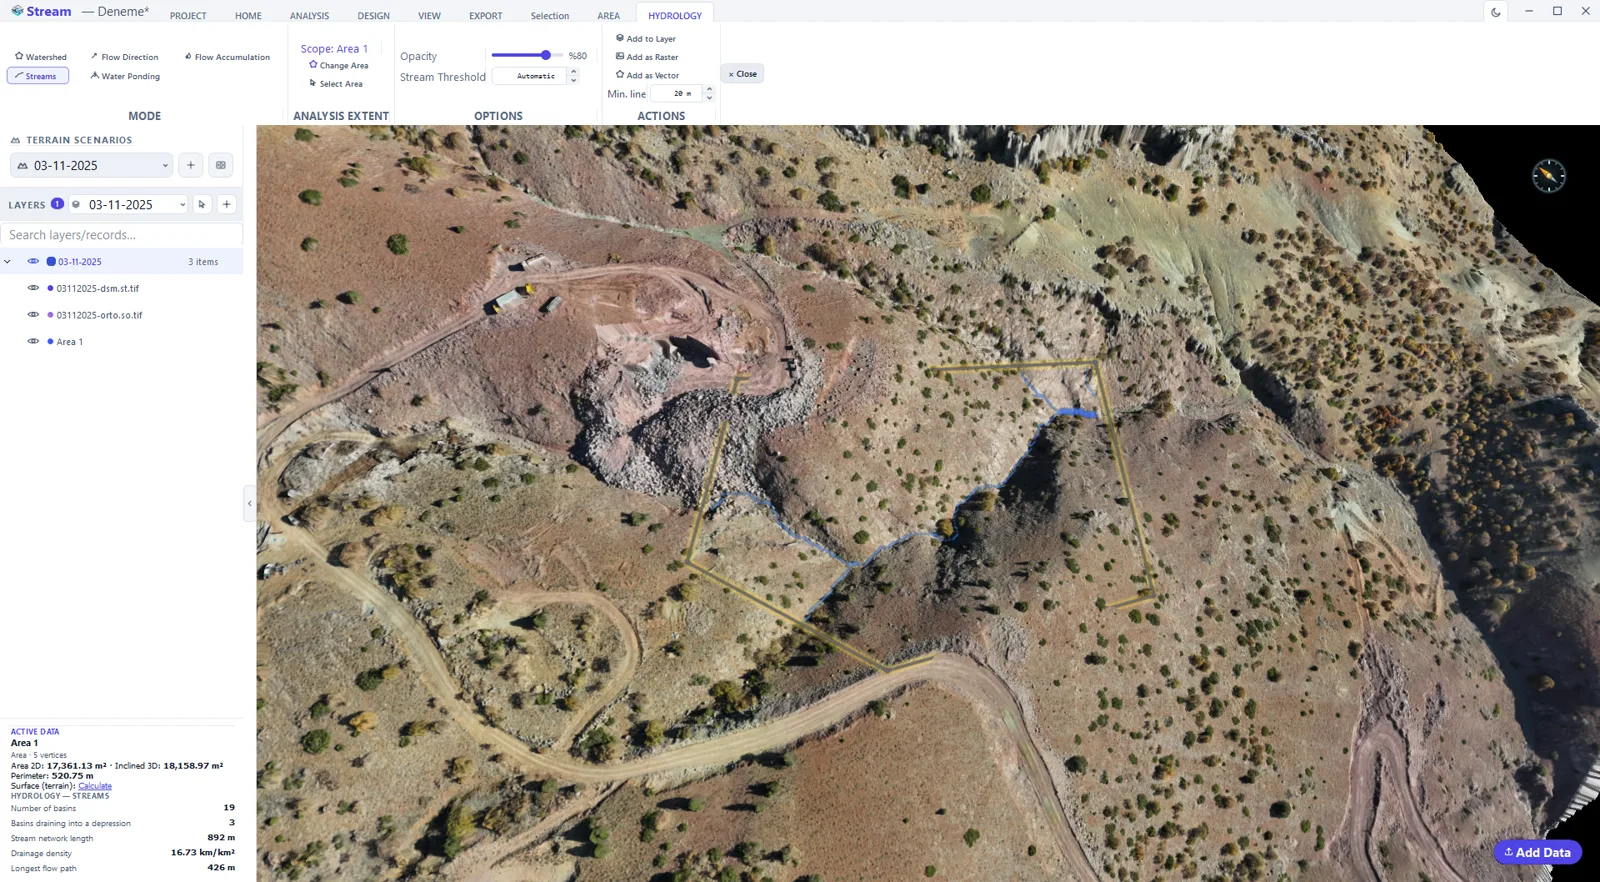
Extract the drainage / stream network implied by the terrain.
Watershed & basins
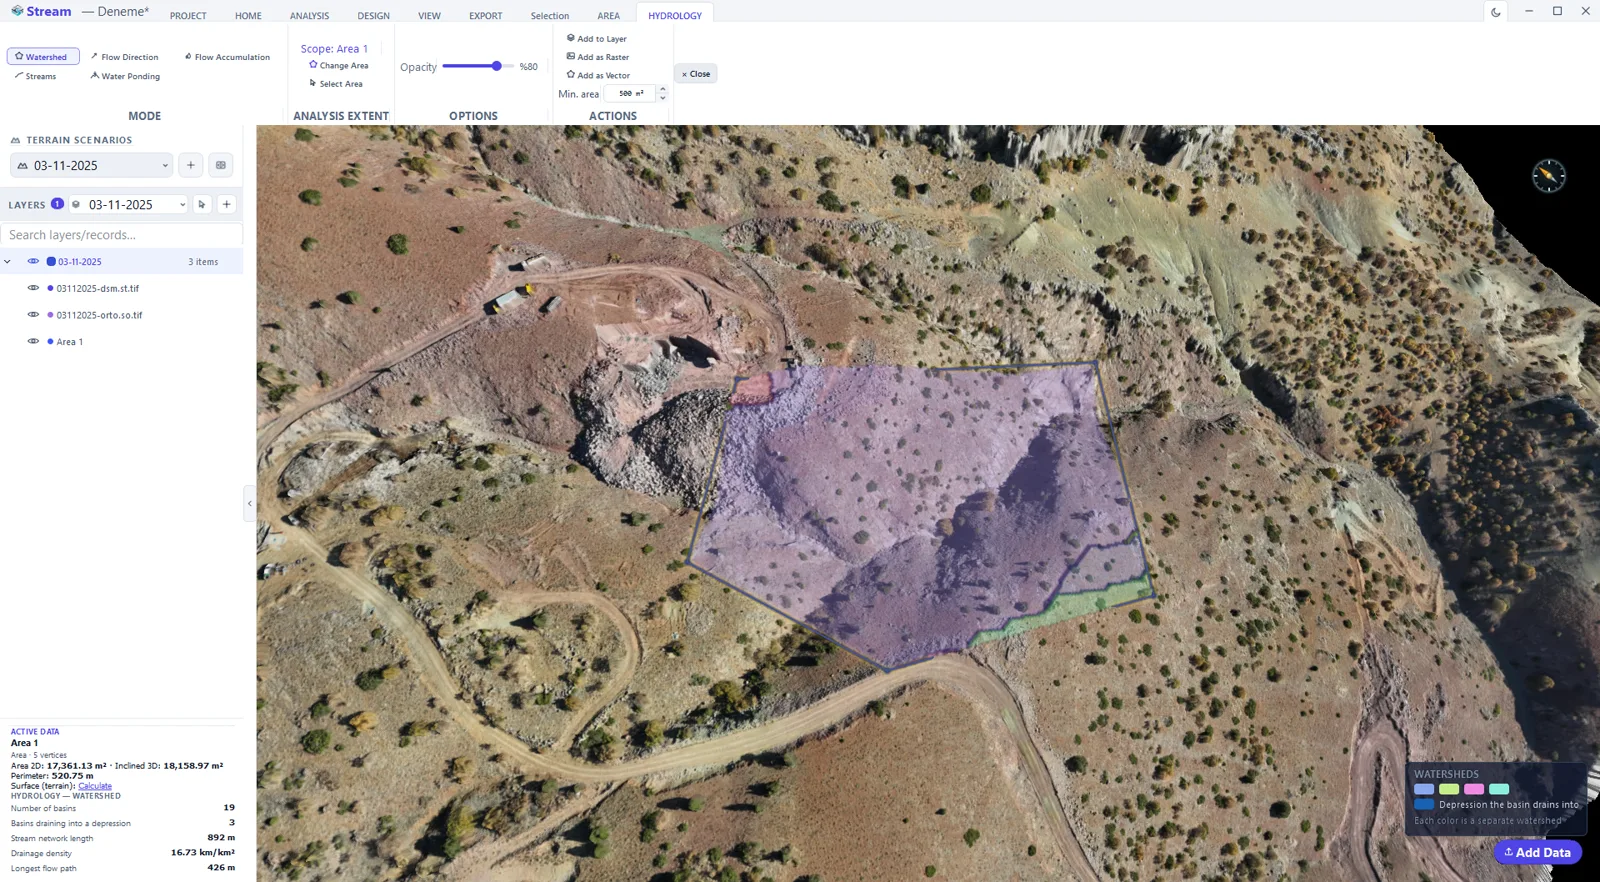
Delineate the catchment area draining to a chosen outlet point.
Live overlays
View results as color layers over the terrain and save them as raster or vector.
Ponding: where water stands and how much
The ponding mode finds the closed depressions on the surface and reports, for each one, its water surface, storage capacity to the spill elevation, deepest and mean depth, spill level and catchment. Small puddles are filtered out by a minimum area and a minimum depth so the result is a list you can act on rather than noise.
A rainfall scenario, not just capacity
Give a rainfall depth, a duration, an infiltration rate and a runoff coefficient, and the ponding result is filled to the level that rainfall actually produces: net = max(0, P − f·D) · C. The report then separates what collects in the depressions from what spills out of the area, counts the overflowing depressions and gives the peak discharge.
Catchment on click, with time of concentration
In watershed mode, clicking the terrain delineates the upstream catchment of that point and reports its area, the longest flow path, the elevation drop along it and an approximate time of concentration by the Kirpich formula. When the catchment runs off the edge of the analysis area it is flagged as a lower bound rather than reported as if it were complete.
Cut a drainage ditch into the terrain
Along a line you draw, STREAM excavates a trapezoidal ditch with a base width, a depth and a side slope, and daylights it into the ground so no vertical wall is left. It becomes a permanent terrain edit that rendering, profiles, cut and fill and every later hydrology run all see, and the long section of the route opens when the cut finishes.
In the product
How to run a watershed and drainage analysis
- 1
Set the scope
Draw or select the area the hydrology runs inside, so the calculation covers the catchment you care about.
- 2
Compute flow direction and accumulation
Flow direction says which way water leaves each cell; accumulation adds up how much drains through it. The stream network comes out of the accumulation threshold you set.
- 3
Delineate the catchment
Place the outlet point and STREAM traces the area draining to it.
- 4
Check where water stands
Ponding shows the depressions that fill before they spill, which is what decides where a ditch has to go.
- 5
Keep or export
Save the stream network and catchment as vectors, the flow rasters as GeoTIFF, and take the figures into the report.
| Mode | What it computes | Vector export |
|---|---|---|
| Watershed | Drainage basins; clicking a point gives its upstream catchment, longest flow path and Kirpich time of concentration | Polygons |
| Flow direction | The steepest descent direction of every cell, on the D8 model | Arrows |
| Flow accumulation | Upslope contributing area, with a dispersive multiple-flow-direction model | Raster only — use the stream network |
| Stream network | Channels extracted from the accumulation, ordered by the Strahler scheme | Lines |
| Ponding | Closed depressions: water surface, storage capacity, depth, spill level and catchment | Water-surface polygons |
Supported formats
Watch it
Frequently asked questions
What hydrology tools does STREAM include?
Flow direction, flow accumulation, stream / drainage network extraction and watershed (basin) delineation — all computed on the DEM.
Is hydrology computed from the DEM?
Yes. All hydrology analysis reads the elevation surface directly, so flow and catchments follow the real terrain.
Can I use it for drainage and flood studies?
Yes. Flow accumulation, stream networks and watersheds are the standard inputs for drainage design and erosion / flood analysis.
Is STREAM standalone hydrology software or part of a larger tool?
STREAM bundles flow direction, flow accumulation, stream/drainage network extraction and watershed (basin) delineation into the same native Windows app you use for terrain, DEM and CAD-GIS work — you don't need separate hydrology software.
Which flow model does STREAM use?
Depressions are filled first, then flow direction is the steepest descent on the D8 model, while flow accumulation uses a dispersive multiple-flow-direction approach so upslope contribution spreads rather than collapsing onto single pixel lines. The stream network is extracted from the accumulation and ordered by the Strahler scheme.
How do I choose the stream threshold?
The threshold is the minimum number of upslope cells a cell needs before it counts as a stream. Leave it at zero and STREAM picks a value itself, writes the value it chose into the record and shows it on the layer card — so an automatic choice is still an auditable one.
What does ponding analysis report?
Per depression: water surface area, storage capacity to the spill elevation, deepest and mean depth, spill level, catchment area, the rainfall depth that would fill it, time of concentration, and whether it overflows. A minimum area and a minimum depth filter out puddles, and if nothing qualifies STREAM says no closed depression was found rather than showing an empty map.
Can I model a specific storm?
Yes. Enter the rainfall depth, its duration, the ground's infiltration rate and a runoff coefficient. Net rainfall is max(0, P − f·D) · C, and the water surfaces are drawn at the level that produces. The report separates what is stored from what spills out of the area, names how many depressions overflow and gives the peak discharge.
What is the time of concentration figure?
An approximate Kirpich estimate for the clicked catchment, derived from the longest flow path and the elevation drop along it. It is reported as approximate because it is an empirical formula, and STREAM prints the flow model and the analysis cell size beside it so the number can be judged.
Road embankments dam my flow paths. Can I fix that?
Yes, with depression breaching. Set a height above which thin artificial barriers — a road fill, a dyke — are cut through instead of being filled, and genuine deeper depressions are preserved. It changes the surface, so hydrology is computed twice and the option is off by default.
How do I calculate the catchment area of a point?
Run the Watershed mode and click the point where the water leaves, the pour point. STREAM follows the flow directions of the DEM upslope, delineates everything that drains to that point and reports its catchment area. The Catchment Report then puts the area, the pour point and the slope and flow length summary into a PDF, and the catchment itself exports as a polygon.
What can I export from a hydrology run?
All five modes export as a GeoTIFF raster. Vector export follows the mode: watersheds as polygons, flow direction as arrows, streams as lines, ponding as water-surface polygons — flow accumulation is raster only, so use the stream network when you need vectors. Ponding also produces a PDF report and a CSV of the raw numbers, and a clicked catchment has its own PDF.
Where this is used
Try Hydrology in STREAM
Free beta for Windows x64. Works fully offline with GeoTIFF, LAS/LAZ and DXF.
Download STREAM free