STOCKPILE
Stockpile Measurement Software for Mining & Quarry Sites
STREAM is stockpile volume software that measures the volume and tonnage of material piles directly from your terrain surface — fully offline, on a DEM or a point-cloud-derived surface. Outline the pile, choose the reference base and the material, and a stockpile survey becomes a volume, a tonnage and a print-ready PDF report for mining, quarry, aggregate and earthworks sites.
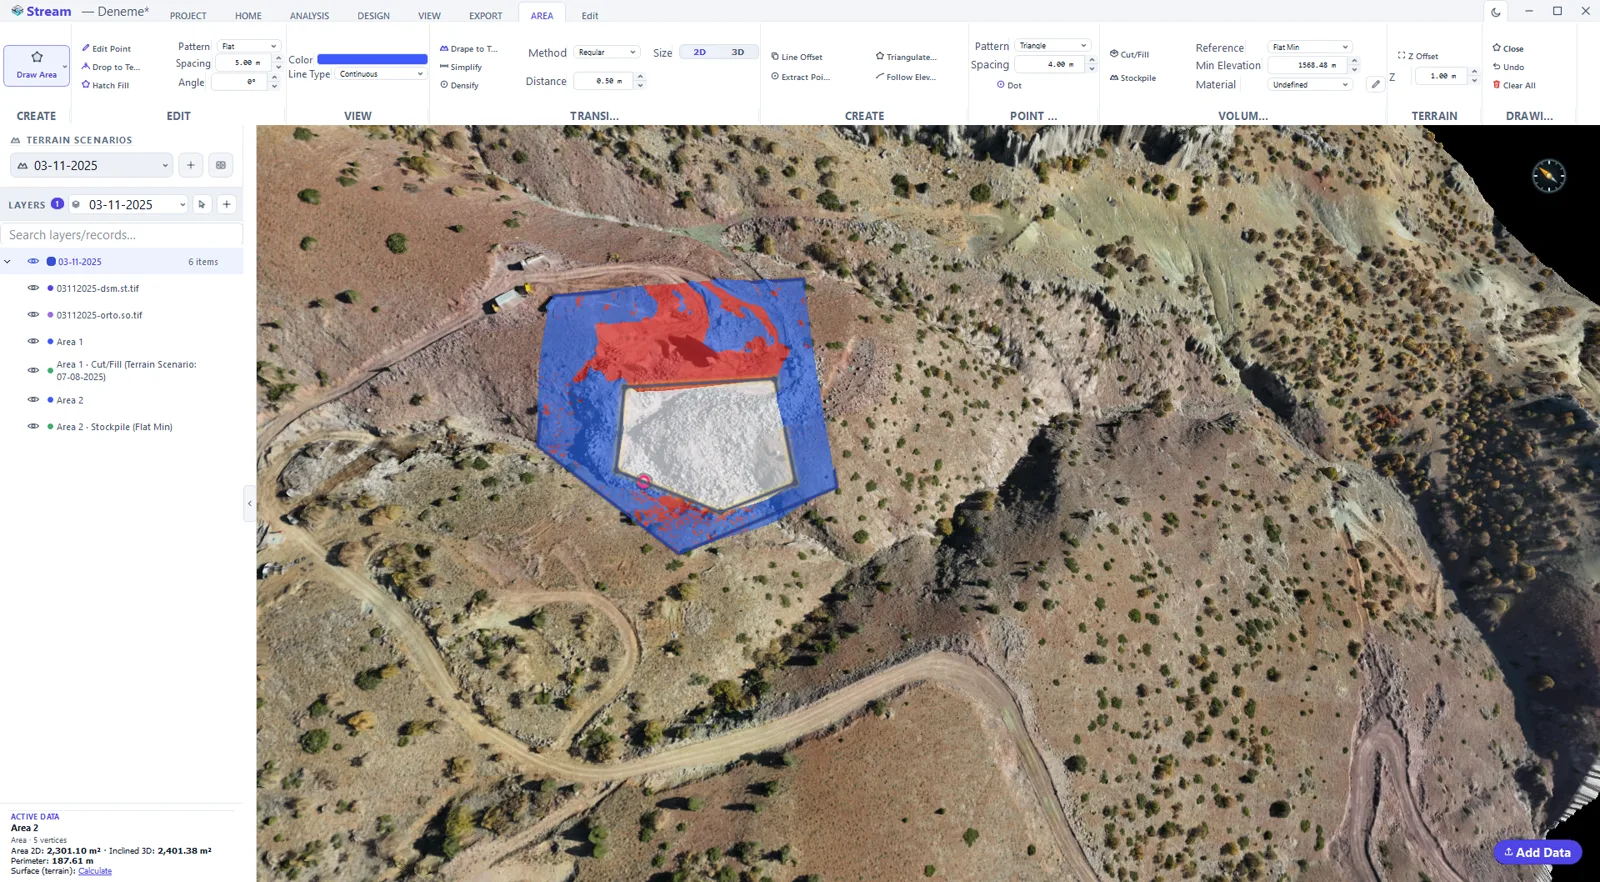
How is stockpile volume measured?
Stockpile volume is the material above a reference base — the toe of the pile. The result depends on how that base is defined, so a good reference mode matters.
Multiplying volume by material density gives tonnage, which is what most inventory and reconciliation reports actually need.
Cone, ridge and irregular stockpiles are all measured the same way — as the volume above the chosen reference base on a single terrain surface — so pile shape doesn't call for a different tool or workflow.
One thing worth being explicit about: a stockpile volume calculation from a survey is an in-situ figure — the material as it sits. Loaded material bulks, so a haulage or truck-count number will not equal the in-place number unless a swell factor is applied on top of it. STREAM reports the in-place figure and leaves that factor to you rather than quietly baking one in.
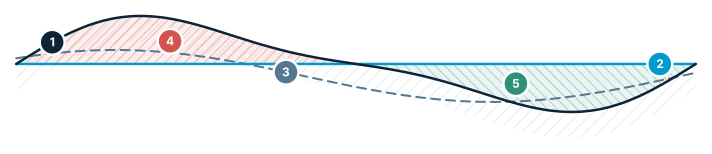
Cut / Fill — three reference modes
Same terrain, three references → three different volumes. The most confusing point for users.
- Existing terrain — the surveyed surface
- Flat level — a fixed design elevation
- Reference surface — another scenario or design
- Cut — above the reference → removed
- Fill — below the reference → added
Stockpile Measurement Software in STREAM
Five reference bases for the pile toe
The volume is measured above a base you pick: a surface triangulated through the corners of the boundary you drew, a level you type in, the lowest corner of that boundary, another terrain scenario such as the empty pad from an earlier survey, or your own TIN surface.
Volume to tonnage from a material library
Each material carries a name, a colour, a density (t/m³) and a unit price, so a measured pile becomes tonnage and — when you have priced the material — an estimated value. The currency symbol is yours to choose.
Nothing is filled in with a guess
If the unit price is 0, the value column is not written at all. If no material is assigned, the pile stays Undefined: the volume is still reported and tonnage is simply left out. The report never invents a figure you did not supply.
Every pile in one report
The stockpile report gathers the whole yard into a single PDF: a numbered site view over the orthophoto, a summary of volume, tonnage and value, then a detail page per pile. The numbers on the map and the rows in the table match one-to-one.
In-place volume, stated as such
Tonnage is derived from in-situ volume. Material bulks when it is loaded, so if you are planning haulage, apply your own swell factor on top — the reported figure is the material in place, not on a truck.
Re-survey and compare
Fly the yard again and measure the same piles on the new surface, or take the earlier survey as the reference base directly, so you read what moved between two dates rather than two absolute numbers.
Works on any surface
Measure piles on a DEM or on a point-cloud-derived surface, fully offline, with no cloud upload required.
Works with your existing survey data
Measure stockpiles from a drone photogrammetry DEM or a LiDAR point cloud — whichever produced your terrain model, rasterized to a surface STREAM can compute on.
How to measure a stockpile in STREAM
- 1
Load the survey surface
Open the DEM of the yard (GeoTIFF), or import the LAS/LAZ point cloud from the flight and let STREAM rasterize it to a surface.
- 2
Outline the pile
Draw the area around the pile, following its toe on the ground. This boundary is what the volume is integrated inside, so trace the toe rather than a comfortable rectangle around it.
- 3
Choose the reference base
Pick what the volume is measured above: the surrounding real terrain, a flat level you type, the lowest point of your boundary, an earlier survey of the same pad, or your own TIN surface.
- 4
Pick the material
Choose the material so its density converts the volume to tonnage, and its unit price to an estimated value. Skip this and the pile is still measured — it is simply recorded as Undefined, with volume only.
- 5
Measure the pile
Run the stockpile calculation. The pile is kept as a numbered record in the yard, so you can go on to the next one and keep them all together.
- 6
Export the report
Export the stockpile report: one PDF with a numbered site view, the volume, tonnage and value summary, and a detail page per pile, ready to hand to a client or auditor.
| Figure | How STREAM produces it | What it is not |
|---|---|---|
| Volume | The material above the reference base you chose, integrated from the survey surface inside the boundary you drew. | Not a modelled or assumed pile shape — it is the surface you loaded, measured. |
| Tonnage | Volume multiplied by the density recorded for that material in the library. | Not a weighed figure. It inherits whatever density you entered, so moisture alone will move it. |
| Value | Tonnage multiplied by the unit price on the material, in the currency you picked. Omitted entirely when the price is 0. | Not a market valuation — it is your own price, arithmetic only. |
| Pile number | Assigned per pile, printed on the orthophoto site view and repeated in the summary table. | Not an arbitrary ordering — the map and the table are meant to be checked against each other. |
Supported formats
Frequently asked questions
How does STREAM measure stockpile volume?
It integrates the material above a reference base you choose — the pile toe — directly from the terrain surface, inside the boundary you drew. There are five reference modes, so the base can be the real surrounding ground, a level you type, the lowest corner of the boundary, an earlier survey of the same pad, or your own TIN surface.
Can STREAM report tonnage?
Yes. Each material in the library carries a density, and the measured volume is converted to tonnage with it. If the material also has a unit price, an estimated value is reported alongside — and if the price is 0, the value column is left out rather than filled with a zero.
Why doesn't the tonnage match the weighbridge?
Two usual reasons. The tonnage is volume times the density you entered, so it is only as good as that density — a change in moisture alone shifts it. And the volume is in-situ: the material as it sits. It bulks when it is loaded, so a truck-count or haulage figure will not equal the in-place figure unless you apply a swell factor yourself. STREAM reports the in-place number and does not silently apply a bulking factor.
How accurate is a stockpile measurement?
The volume is computed from your survey surface, so its accuracy is the accuracy of that surface and of the base you chose. In practice the base is the larger error source: a toe traced loosely, or a flat level assumed on a pad that is not actually flat, moves the figure far more than DEM resolution does. STREAM does not model or estimate the pile — it measures the surface you loaded.
Can I measure several stockpiles and report them together?
Yes. Every pile you measure is kept as a record in the yard, and the stockpile report gathers all of them into one PDF: a numbered site view over the orthophoto, a summary table of volume, tonnage and value, then a detail page per pile. The numbers on the map and the rows in the table match one-to-one.
Can I use STREAM for stockpile inventory?
Yes, for survey-based inventory: fly or scan the yard at each count — month-end, quarter-end — measure every pile on the new surface, turn volume into tonnage from the material library and report all piles in one PDF. Measuring the same pile outlines on each survey keeps the figures comparable from one count to the next.
Does STREAM do continuous stockpile monitoring or inventory tracking?
No. STREAM measures stockpiles from a survey you have already flown or scanned. It is not a live monitoring system: it does not connect to sensors, scales, cameras or an ERP, and it does not update a figure on its own. If you re-survey the yard you can measure the same piles again and compare the two surveys, but the cadence is yours to set.
Can I measure a stockpile from a LiDAR point cloud?
Yes. Import the LAS/LAZ cloud and STREAM rasterizes it to a surface on import; the pile is then measured on that surface exactly as it would be on a photogrammetry DEM.
Is it suitable for mining, quarry and aggregate sites?
Yes. Volume and tonnage per pile with a numbered PDF report is built for mining, quarry, aggregate and earthwork inventory — including material stockpile surveys where several piles have to be reported together.
What file formats does STREAM's stockpile volume software support?
GeoTIFF DEMs and LAS/LAZ point clouds, rasterized to a surface on import, with an optional orthophoto behind the site view — all processed fully offline, with no cloud upload required.
Which reference mode should I use for a stockpile survey?
Use the real terrain when the surrounding ground is unchanged and representative, a flat level when the pad genuinely is level, the lowest boundary corner when you want everything above the low point, and an earlier terrain scenario when you are measuring against the empty pad or tracking change between two surveys.
Try Stockpile Measurement in STREAM
Free beta for Windows x64. Works fully offline with GeoTIFF, LAS/LAZ and DXF.
Download STREAM free