SUN & SHADOW
Sun and Shadow Analysis Software
STREAM's sun and shadow analysis software computes how many hours of sunlight each point on your terrain receives, with real topographic shadow cast by the surrounding relief — not a flat, shadow-free estimate. Choose an instant, day, month or full year, set the latitude, and map sunlit versus shaded ground across the whole surface.
What is sun and shadow analysis?
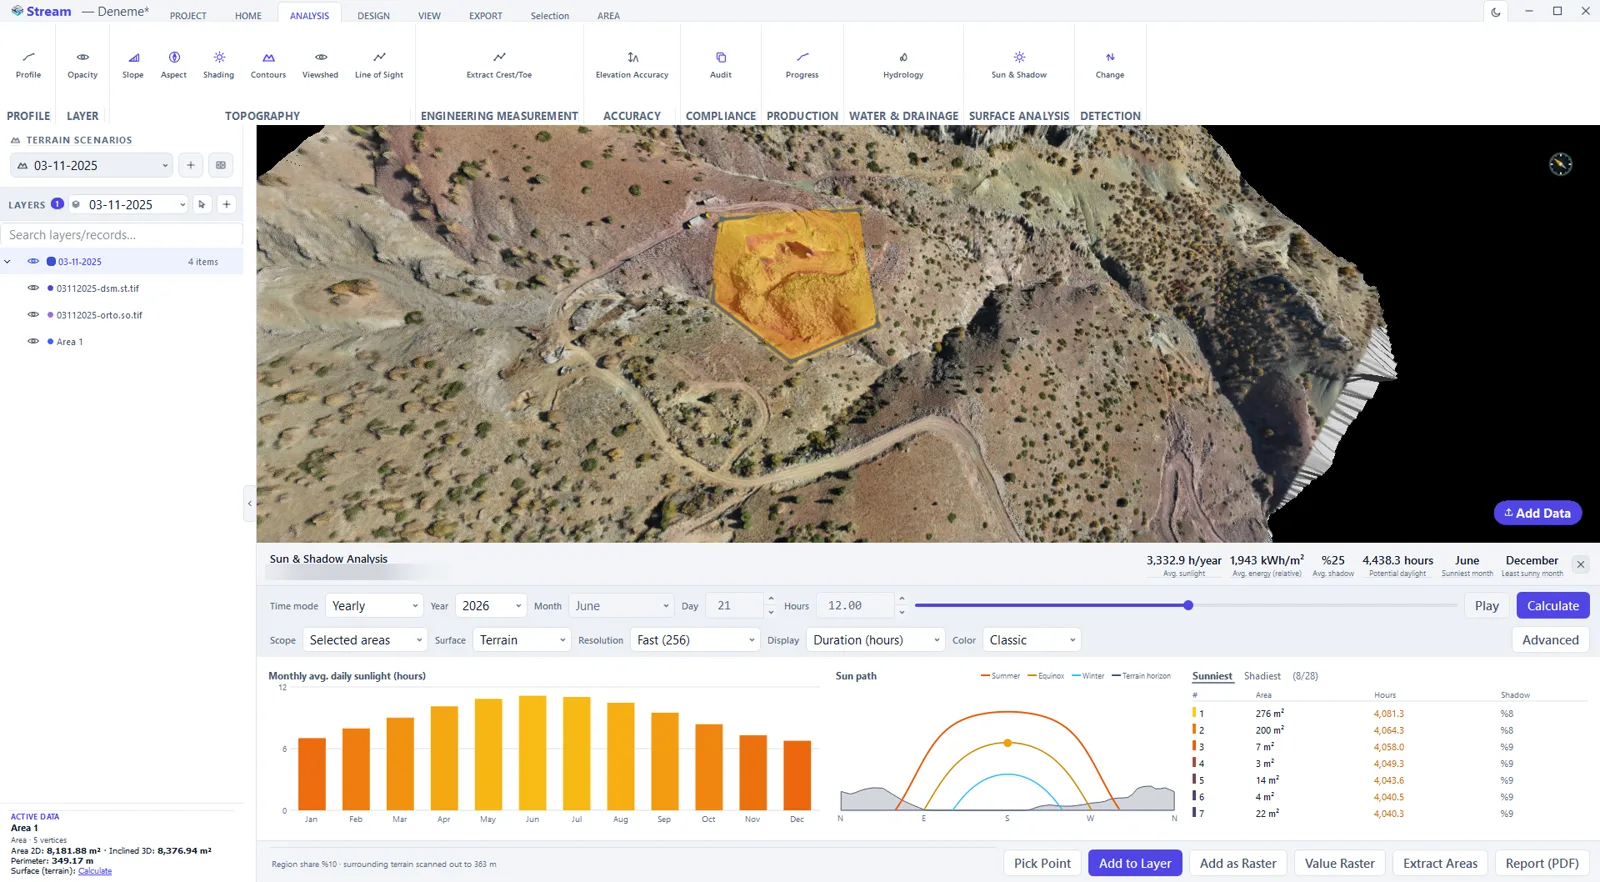
Sun and shadow analysis simulates the sun's path over an elevation surface and computes how long each point is lit versus shaded by the surrounding terrain. The result is a sunlight-hours map, not just a single shading image.
It matters wherever exposure drives a decision — solar panel siting, agriculture and greenhouses, landscape and building layout.
Sun and Shadow Analysis Software in STREAM
Sunlight hours with real shadow
Compute sunlight duration per cell including topographic shadow cast by the surrounding relief.
Instant, daily, monthly, yearly
Pick the time mode and set the latitude; STREAM sums exposure over the period you choose.
Find the sunniest areas
Rank and highlight the areas that receive the most sun across the site.
Export the result
Add it as a layer, a GeoTIFF raster, or export the sunniest spots as a numbered 3D point (DXF) layer.
One license, the same terrain
Sun and shadow analysis shares the same DEM as slope, aspect, viewshed, hydrology and change detection in STREAM — no separate solar-analysis license or re-import.
A sun-path diagram against your own horizon
The panel draws the solar dome for your latitude — the summer solstice arc, the equinox arc, the winter arc and the arc of the day you picked — over the silhouette of the surrounding terrain. Where an arc dips below that silhouette, the site is in shadow. In instant mode the real sun position for your date and time is marked on it.
The monthly profile, and the worst month
A twelve-month bar chart shows average daily sunlight hours through the year, and badges name the sunniest and the least sunny month. Panel and bench layouts are designed for the worst month, not the average, so that number is on the screen rather than buried in a table. Months that were not scanned are drawn differently from months that came out at zero.
Classified colouring you control
Set the low and high sunlight-hour bounds by hand or leave them automatic, and choose a continuous ramp or 3, 5 or 8 discrete classes in one of four colour schemes. Recolouring is instant — the result is not recomputed — so you can find a threshold visually and keep the same numbers underneath.
In the product
How to run a sun and shadow analysis
- 1
Load the terrain
Open the DEM of your site (GeoTIFF), or import a LAS/LAZ point cloud and let STREAM rasterize it to an elevation surface.
- 2
Draw the analysis area
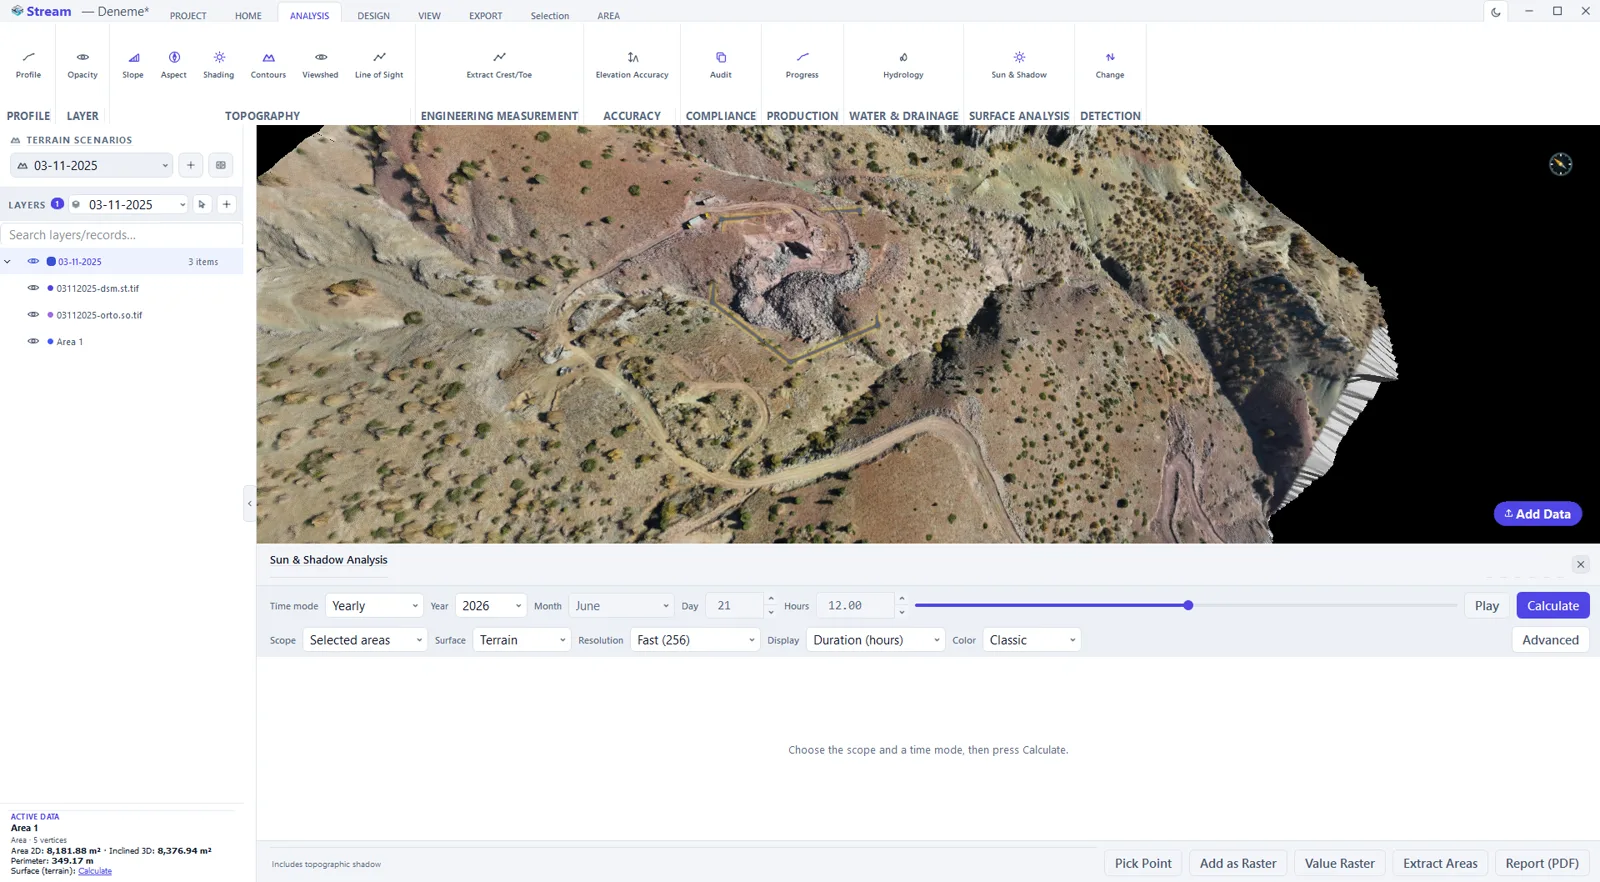
Mark the area you want to study. Relief outside that boundary is still taken into account for cast shadow, so a ridge beyond the site does not silently disappear.
- 3
Pick the time period
Choose an instant, a day, a month or a full year, and set the date. Latitude and longitude come from the project coordinate system, so the sun path matches the real location.
- 4
Compute the sunlight map
Run the analysis to get sunlight hours per cell, including the topographic shadow cast by the surrounding terrain.
- 5
Read the sunniest areas
The ranked list of the best-lit areas is linked to the map — selecting an entry takes the view to it, so you can inspect the ground before deciding.
- 6
Export the result
Keep it as a layer, save the sunlight-hours map as a GeoTIFF raster, or export the sunniest spots as a numbered 3D point layer in DXF.
| Time mode | What is computed | Result unit |
|---|---|---|
| Instant | The shadow at one date and one hour of local mean solar time | Percentage of the area in sun, plus the sun's position on the sun-path diagram |
| Daily | Total sunlight over the chosen day, with topographic shadow | Hours per day |
| Monthly | Total sunlight over the chosen month | Hours per month |
| Yearly | All twelve months scanned; month, day and hour inputs are switched off | Hours per year, plus the sunniest and least sunny month |
Supported formats
Watch it
Frequently asked questions
Does STREAM include topographic shadow?
Yes. Sun & shadow analysis includes the shadow cast by the surrounding relief, so results reflect the real terrain, not a flat surface.
Is the result in energy (kWh)?
No — results are in sunlight hours (relative, clear-sky), meant for comparing areas against each other, not absolute energy yield.
What is it used for?
Solar panel siting, agriculture and greenhouse planning, and landscape or building layout — anywhere sun exposure and shadow matter.
Is STREAM's sun and shadow analysis software free?
Yes — it's included in the free Windows x64 beta, with no separate charge for this feature.
How do I run a sun hours analysis?
Draw and select an area, open Analysis ▸ Surface Analysis ▸ Sun & Shadow, choose a time mode — instant, daily, monthly or yearly — set the date and press Calculate. Latitude and longitude are filled in from the project's coordinate system, and you can override the latitude by hand if you need to.
What is the difference between the four time modes?
Instant gives the shadow at one date and hour and reports the percentage of the area in sun. Daily totals the sunlight of one day in hours per day. Monthly totals a chosen month. Yearly scans all twelve months and reports hours per year; in that mode the month, day and hour boxes are switched off because they are not used.
Where does the latitude come from?
From the project's coordinate system: the centroid of the selected area is converted to EPSG:4326. If you type a latitude yourself it is never overwritten afterwards. If the coordinate system cannot be resolved, STREAM says so and computes the sun position with a default longitude instead of failing silently.
Is the hour value local time or solar time?
Local mean solar time, not the official time zone. True solar noon can differ from it by up to about 16 minutes because of the equation of time, so an instant-mode shadow is accurate to roughly that in clock terms.
How is this different from hillshade?
Hillshade is a schematic shading tool: a time-of-day slider derives a light direction from a closed formula that ignores the project's latitude and date. Sun and shadow analysis uses a real solar position with topographic shadow from the surrounding terrain, and produces a measurable result rather than a look.
Can I get the sunniest areas as data instead of a picture?
Yes. The panel ranks the distinct high-sunlight areas with their size in hectares, mean sunlight hours and shadow percentage, and clicking a row flies the map to it. Add as Vector writes those areas as a numbered 3D point layer in DXF, with a matching CSV carrying rank, X, Y, elevation, area, sunlight hours, shadow percentage and peak hours.
Can the sunlight map become a layer or a GeoTIFF?
Yes. The result starts as a draft that is discarded if you close the panel; Add to Layer makes it a permanent layer saved with the project, and Add as Raster writes the sunlight heat map as a GeoTIFF raster layer without recomputing anything.
Try Sun and Shadow Analysis in STREAM
Free beta for Windows x64. Works fully offline with GeoTIFF, LAS/LAZ and DXF.
Download STREAM free