Change Detection Between Two Surveys
Change detection compares two surfaces of the same site, sampled on a common grid, by subtracting the earlier elevation from the later — producing a signed difference raster where every cell's value is a height change in metres, positive for material added and negative for material removed. Fly the same site twice and you get exactly this map of what moved; it is one of the most useful things you can do with repeat surveys, and one of the easiest to over-read. This guide covers how to decide which parts of the result you are allowed to believe.
The calculation itself is simple
Two surfaces of the same area are sampled on a common grid, and the later elevation is subtracted from the earlier one. Positive values mean material was added, negative means it was removed.
The output is a signed difference raster: a map where the value of every cell is a height change in metres. From it you can derive volumes of gain and loss, and outline the areas that changed.
That is the whole arithmetic. Everything difficult about change detection is in the preparation and the interpretation.
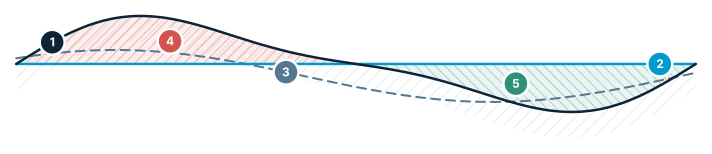
Cut / Fill — three reference modes
Same terrain, three references → three different volumes. The most confusing point for users.
- Existing terrain — the surveyed surface
- Flat level — a fixed design elevation
- Reference surface — another scenario or design
- Cut — above the reference → removed
- Fill — below the reference → added
Alignment comes first
The two surveys must sit in the same coordinate system, horizontally and vertically, or you are measuring your own registration error.
The classic failure is a vertical reference mismatch — one survey processed to ellipsoidal heights, the other levelled to benchmarks. Both look fine on their own; their difference is contaminated by a large, uniform bias.
The diagnostic is easy: look at ground you know did not change — an access road, a bench, a hardstanding. If those stable areas show a consistent non-zero difference, you have an alignment problem, not a change. Fix it before reading anything else.
Not every difference is real
Each survey carries its own uncertainty: control quality, GSD, surface roughness, vegetation, processing noise. When you subtract two uncertain surfaces, the uncertainties combine — the difference is less certain than either input.
So there is a threshold below which a difference cannot be distinguished from noise. It is called the Level of Detection, and it is the single most important number in a change report.
Below the threshold, a cell showing −4 cm and a cell showing +4 cm are telling you the same thing: nothing measurable happened here. Colouring them red and blue makes them look like erosion and deposition, and that is how difference maps mislead people.
Using a Level of Detection
The practical approach is to mask out everything below the threshold and report only what survives. STREAM extracts change areas from the signed difference using exactly this rule — only differences whose magnitude exceeds the level of detection are turned into polygons.
This does two things. It stops small noise from being read as real movement, and it stops noise from inflating volumes: a large area of ±3 cm scatter can add up to an impressive-looking but entirely fictional quantity.
Choose the threshold from the quality of your worst survey, not your best. And write it on the map — a difference map without its detection threshold is not a finished deliverable.
Area of change vs volume of change
These answer different questions. Area tells you where work happened — useful for progress tracking and for spotting activity outside a permitted boundary. Volume tells you how much material moved — the number that gets paid.
Report them together. A large area with a small volume is a thin surface reshaping; a small area with a large volume is a deep cut or a tall stack. The pair describes the site far better than either alone.
Where it earns its keep
Mine and quarry progress: monthly extraction volumes, waste dump growth, and whether the pit is following the plan.
Stockpile monitoring: how much came in and went out between two dates, without measuring each pile from scratch.
Earthworks certification: independent verification of claimed quantities against surveyed reality.
Erosion, landslides and landfill: slow movement that is invisible between two site visits but obvious between two surfaces.
Frequently asked questions
What is change detection between two surveys?
It is the process of sampling two elevation surfaces of the same area on a common grid and subtracting the earlier survey's measurements from the later one's, producing a signed difference raster that shows height change in metres for each cell — positive values mean material was added, negative values mean it was removed.
Why do the two surveys need to be aligned before comparing them?
Because the surveys must share the same coordinate system, horizontally and vertically; a common failure is a vertical reference mismatch (e.g. one survey using ellipsoidal heights and another referenced to benchmarks), which looks fine in each survey alone but introduces bias in the difference. Checking stable features like roads or hardstands for a consistent non-zero difference is how you diagnose this before proceeding.
What is a Level of Detection (LoD) in change detection, and how does STREAM use it?
The Level of Detection is a threshold below which differences between two surveys can't be distinguished from measurement noise, since each survey carries its own uncertainty (control quality, GSD, surface roughness, vegetation, processing noise) that compounds when the two are subtracted. STREAM extracts change areas from the signed difference using exactly this rule — only differences whose magnitude exceeds the level of detection are turned into polygons — so noise isn't mistaken for real movement or counted into volume totals.
What is the difference between area of change and volume of change?
Area of change shows where work happened, which is useful for tracking progress and boundaries, while volume of change quantifies how much material actually moved, which matters for payment purposes; reporting both together gives a complete picture of a site.
Sources
Compare two surveys in STREAM
Native Windows · fully offline · free beta