Define a production project
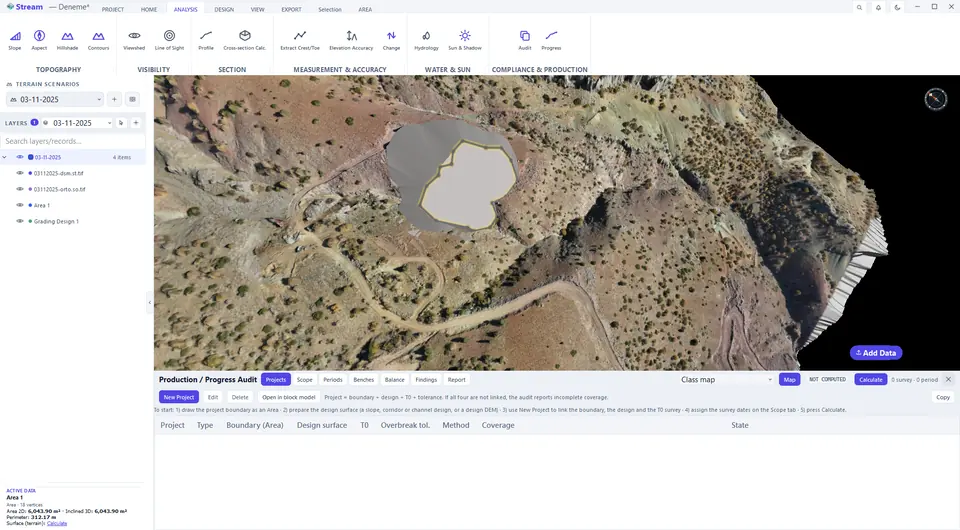
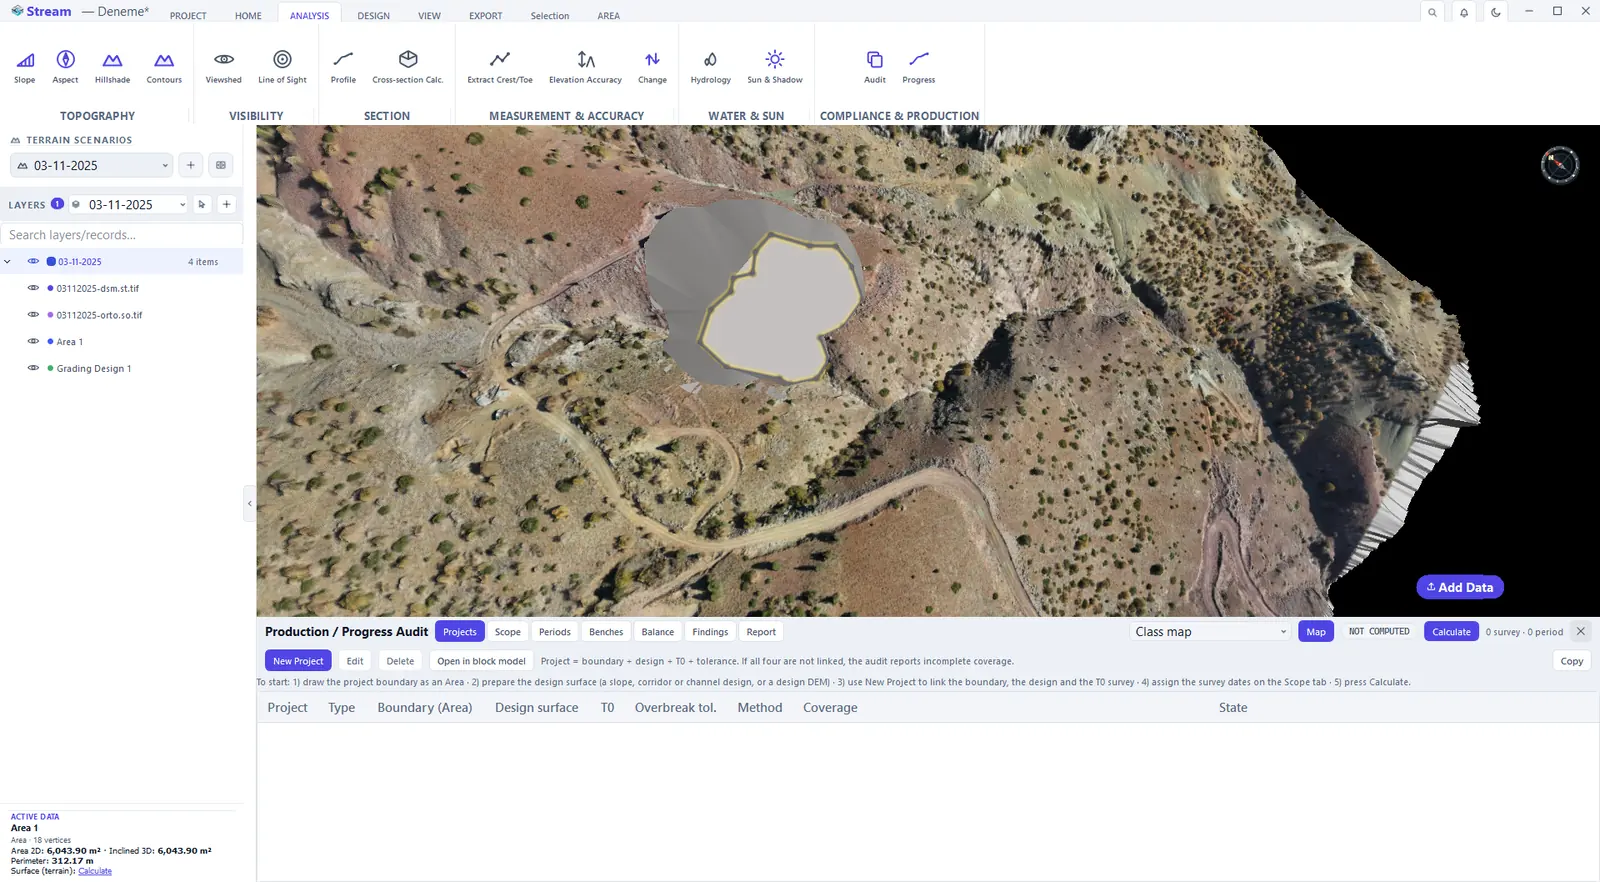
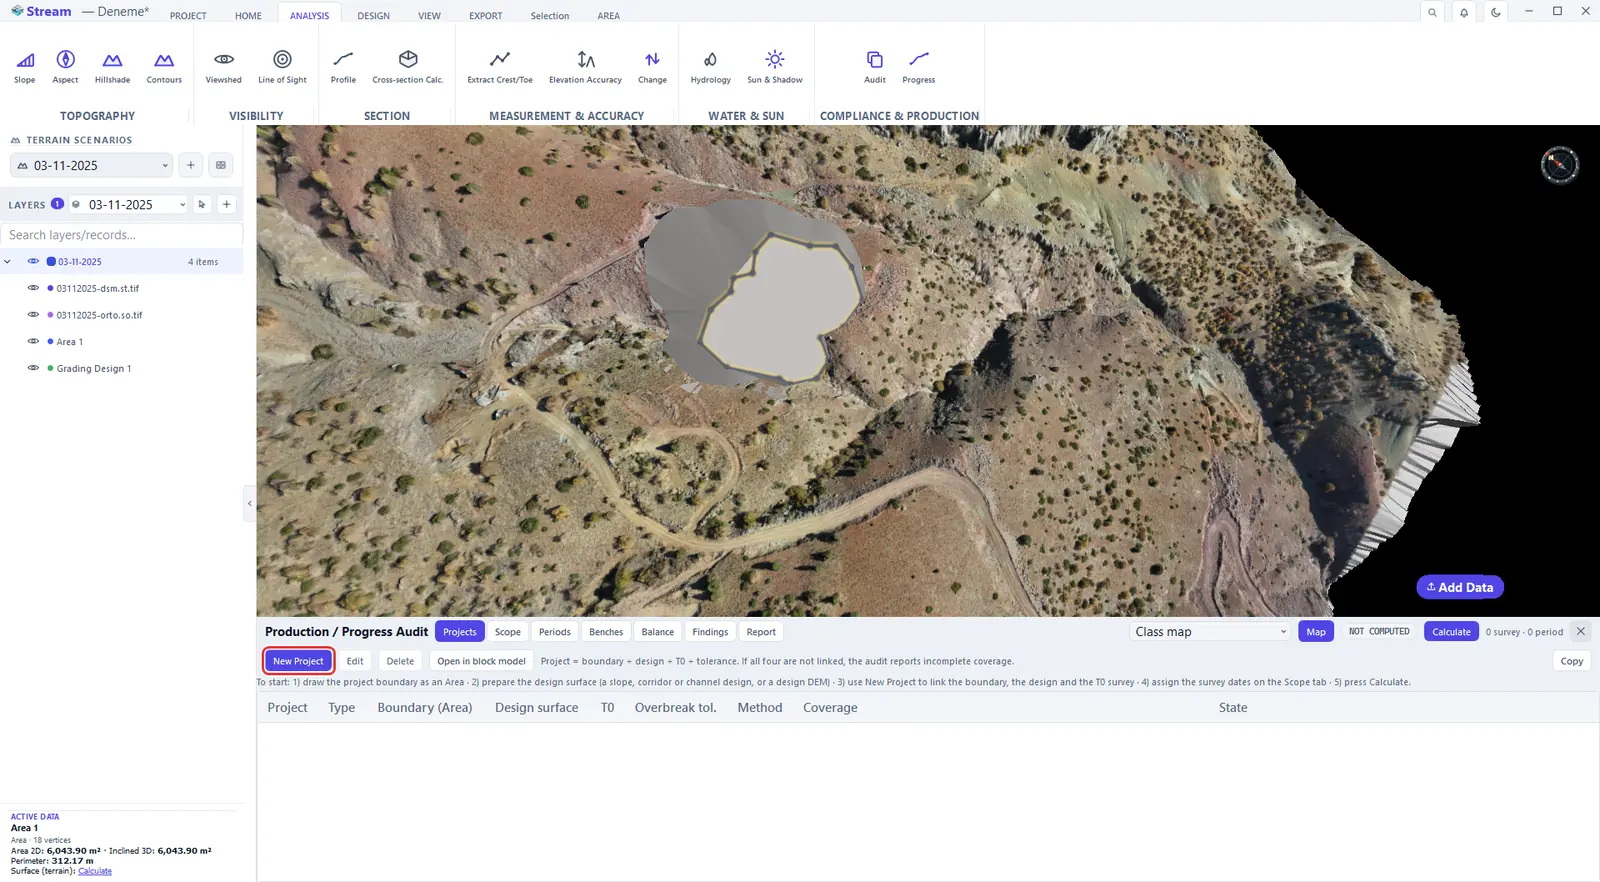
A production project is a boundary (an area), a design surface, a T0 baseline survey and a tolerance. It creates no new geometry: it links records you already have. The panel opens empty with a short checklist: draw the project boundary as an area, prepare the design surface (a slope, corridor or channel design, or a DEM), link both with New Project, assign the survey dates on the Scope tab and press Calculate.
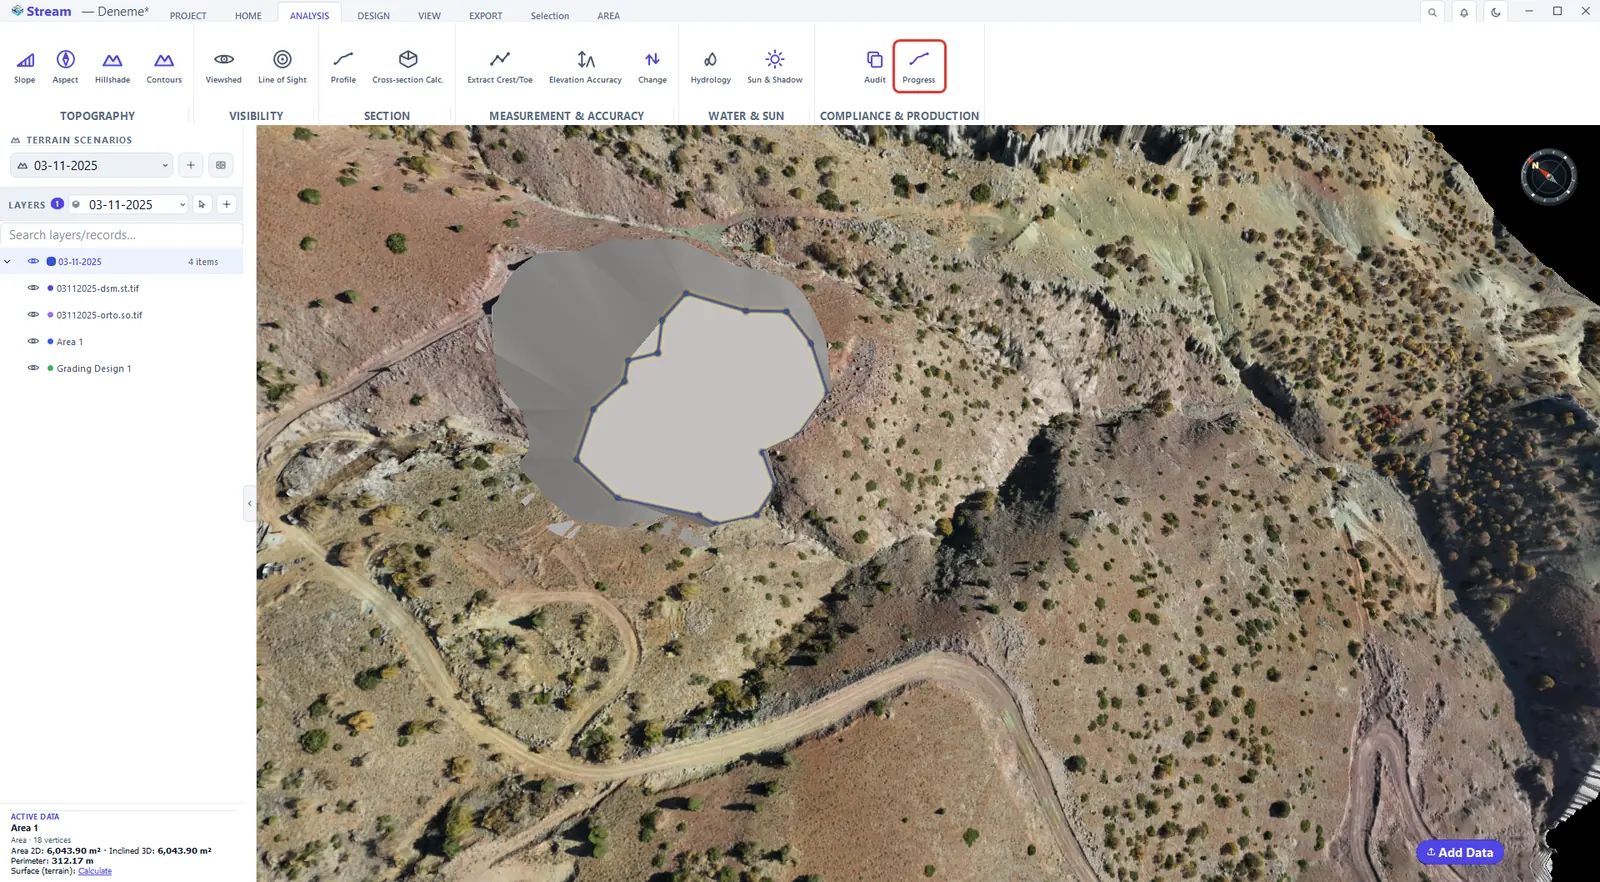
Press Production / Progress on the Analysis tab.
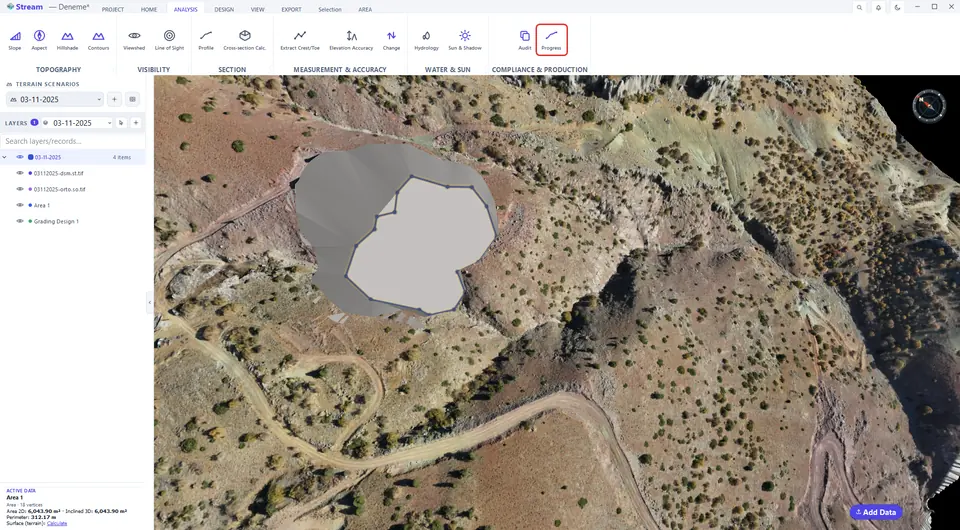
The production panel.
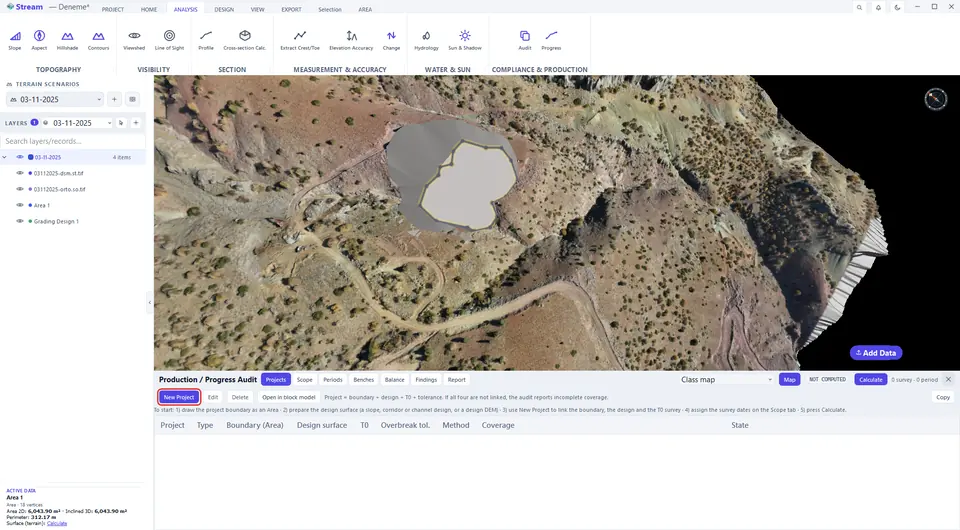
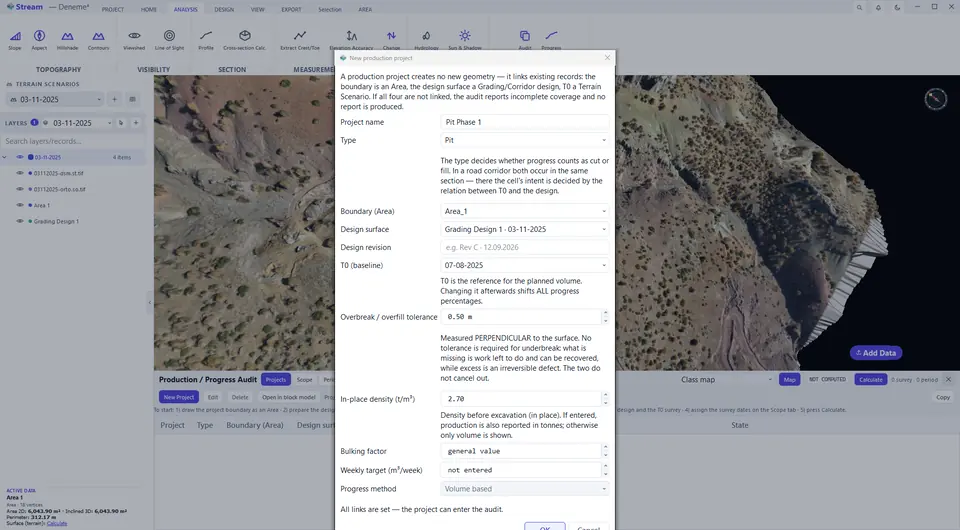
New Project links boundary, design and baseline survey.
Project boundary, design surface and tolerance.
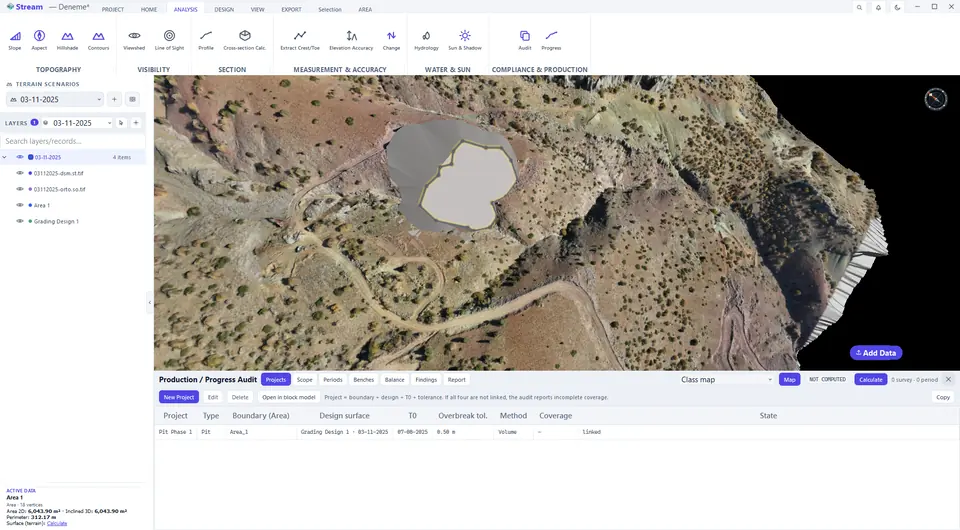
The project is listed.
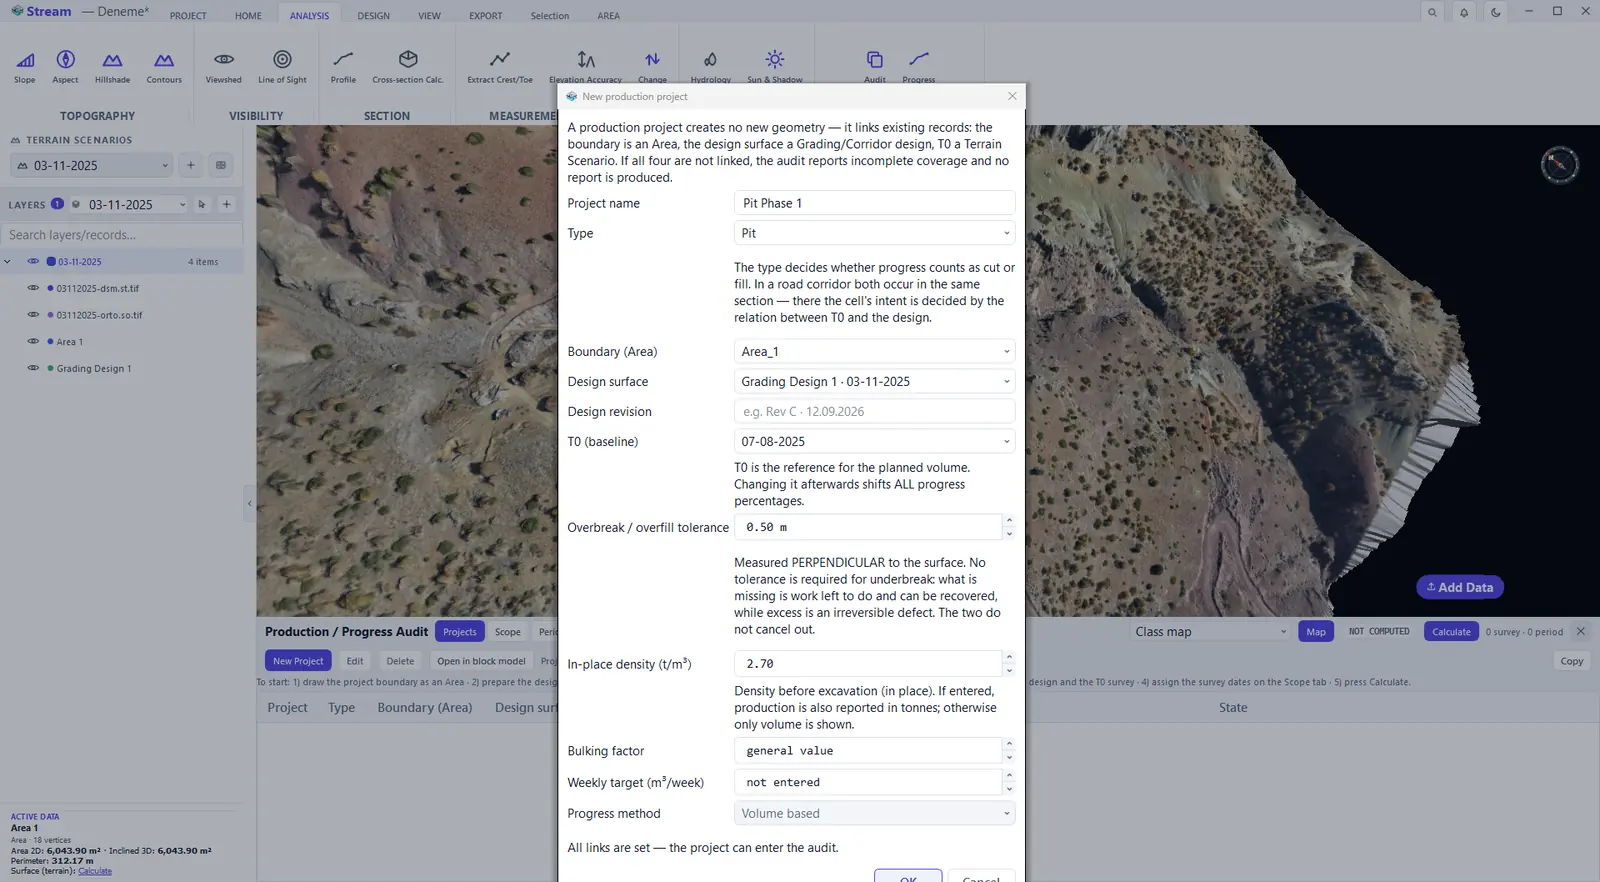

In the New Project dialog you set the name, the type (pit, waste, road or platform), the Boundary (Area), the Design surface and its revision, T0 (baseline) and the overbreak / overfill tolerance, and optionally the in-place density, a bulking factor, a weekly target and the progress method (volume based). T0 is the ground before work began: it tells whether each place should be cut or filled, and changing it afterwards shifts all progress percentages. The dialog states All links are set — the project can enter the audit when nothing is missing; if a link is missing it names it, and the audit reports an incomplete scope. Two projects' boundaries must not overlap, because the same volume would be counted twice.
Date the surveys and calculate
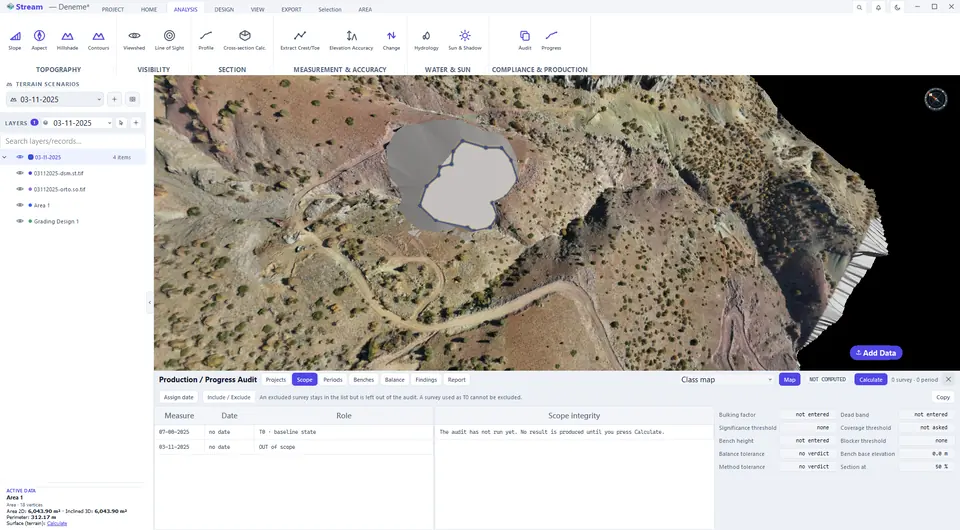
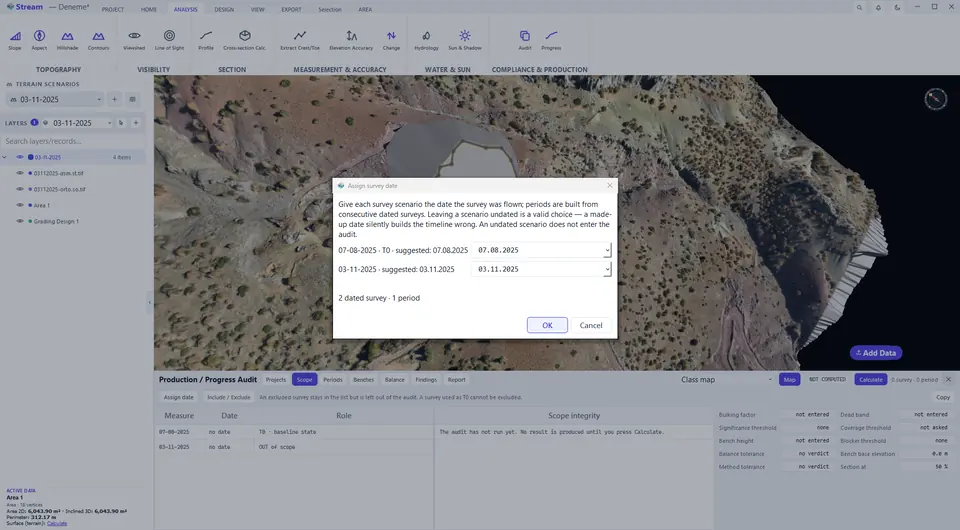
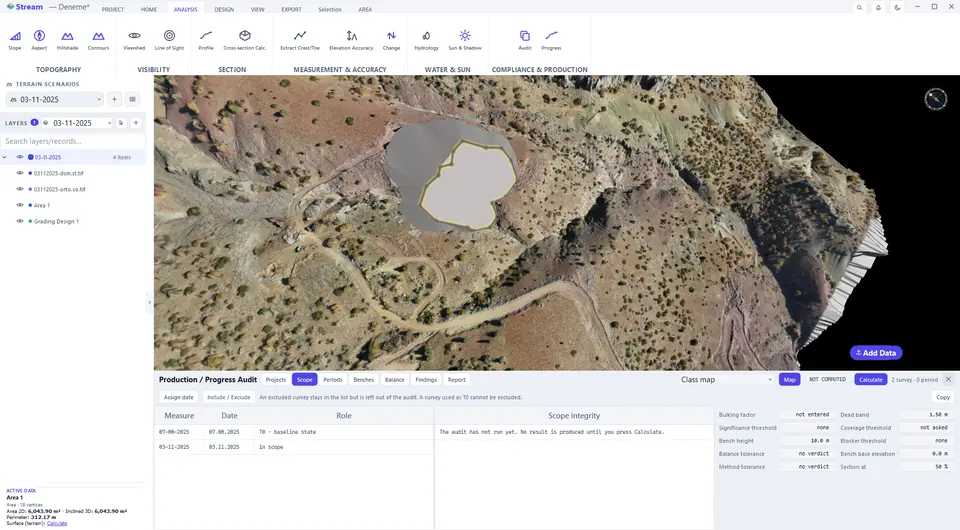
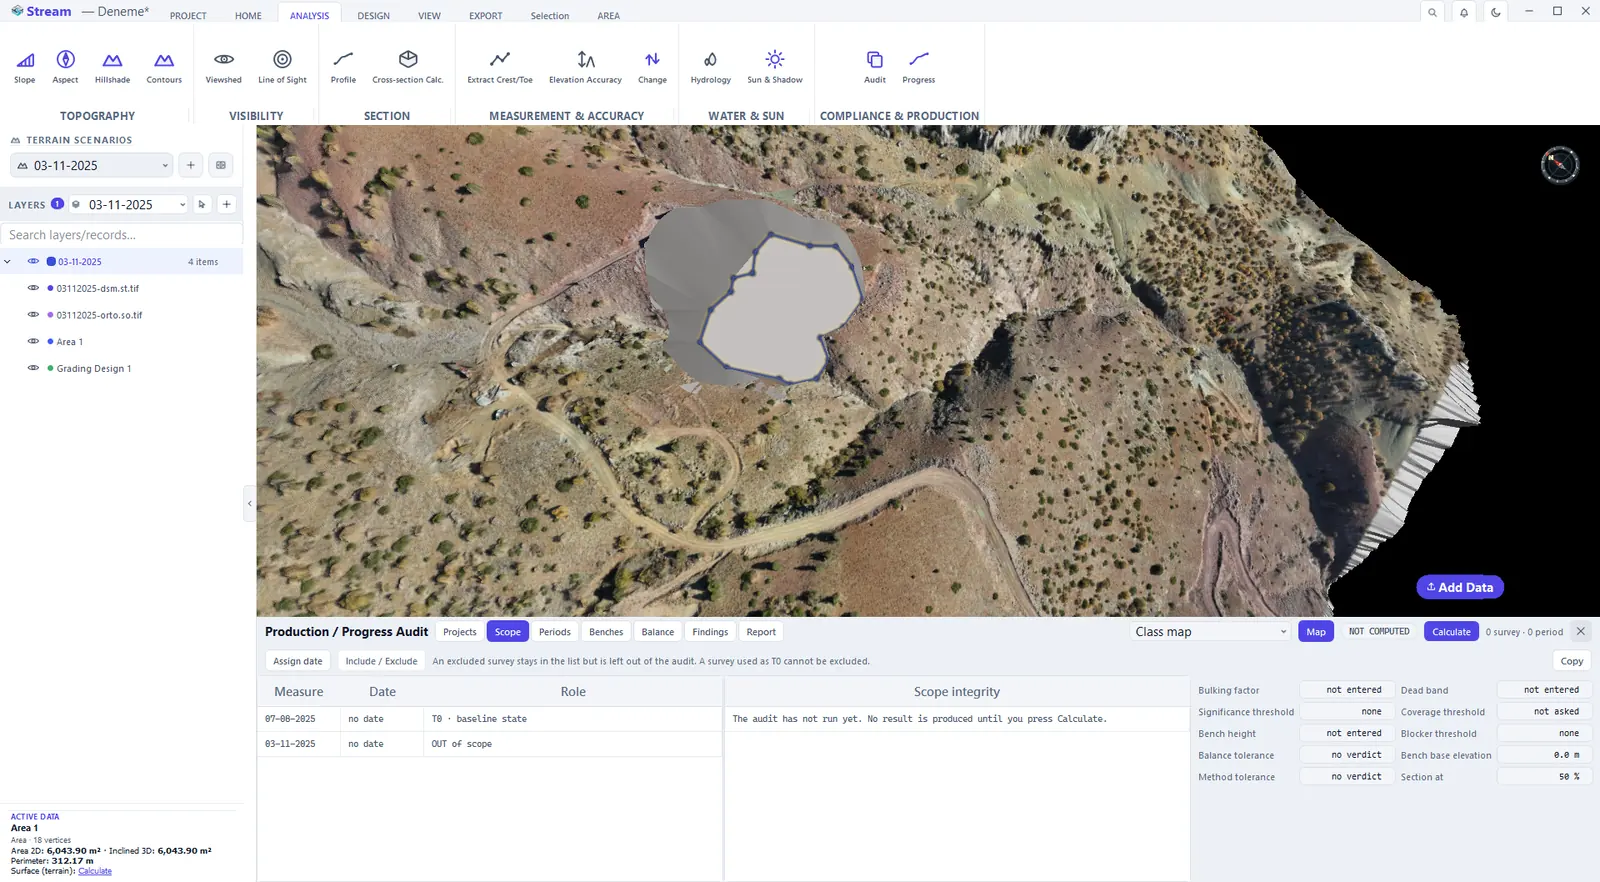
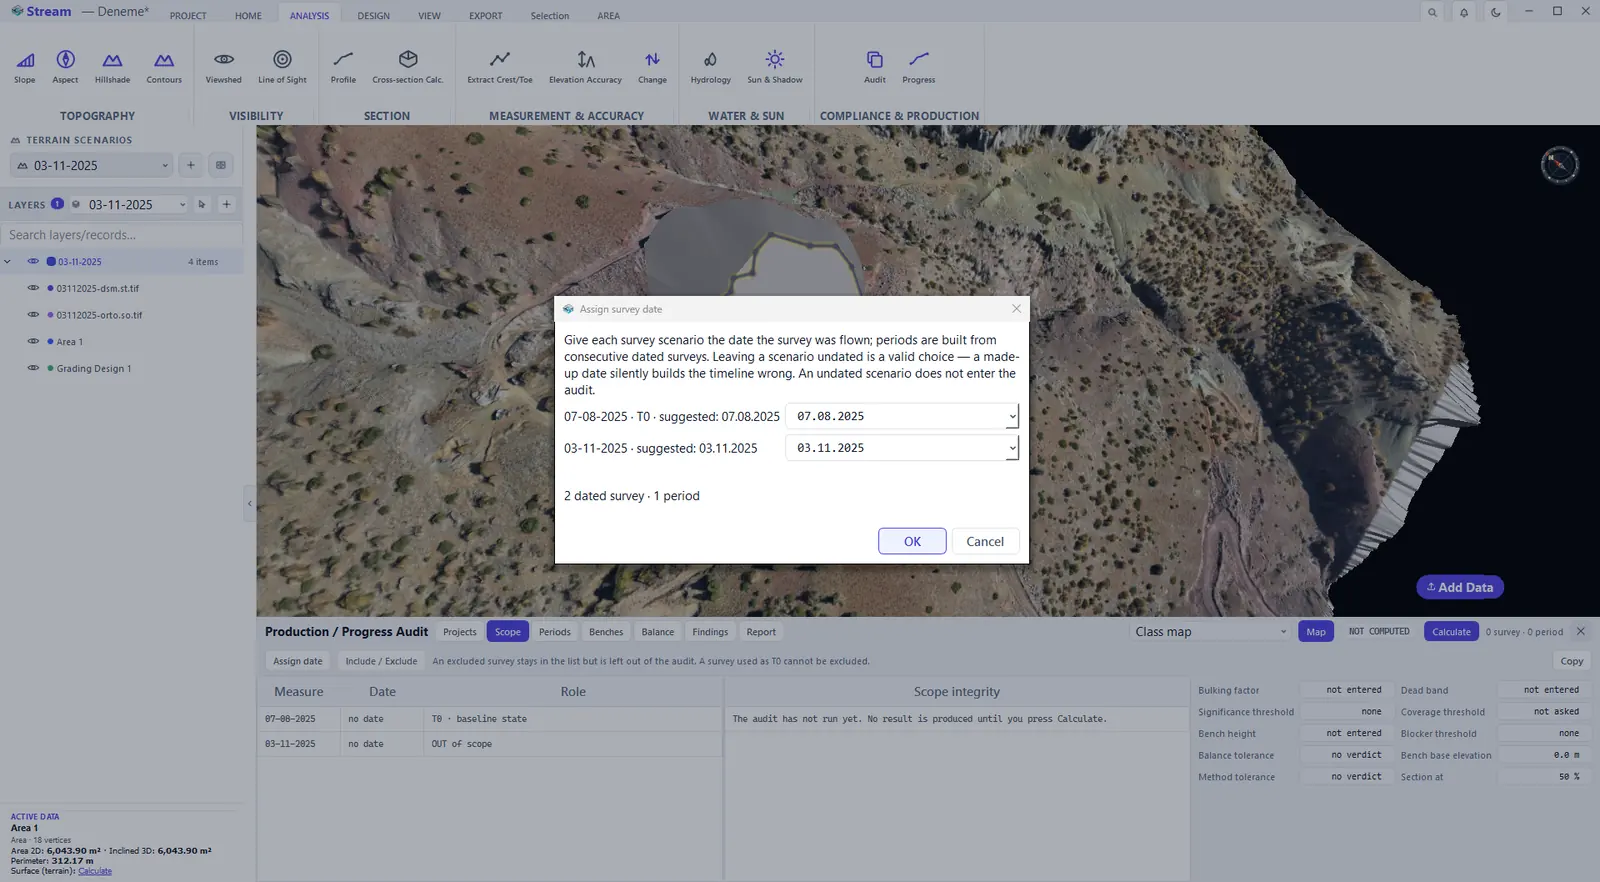
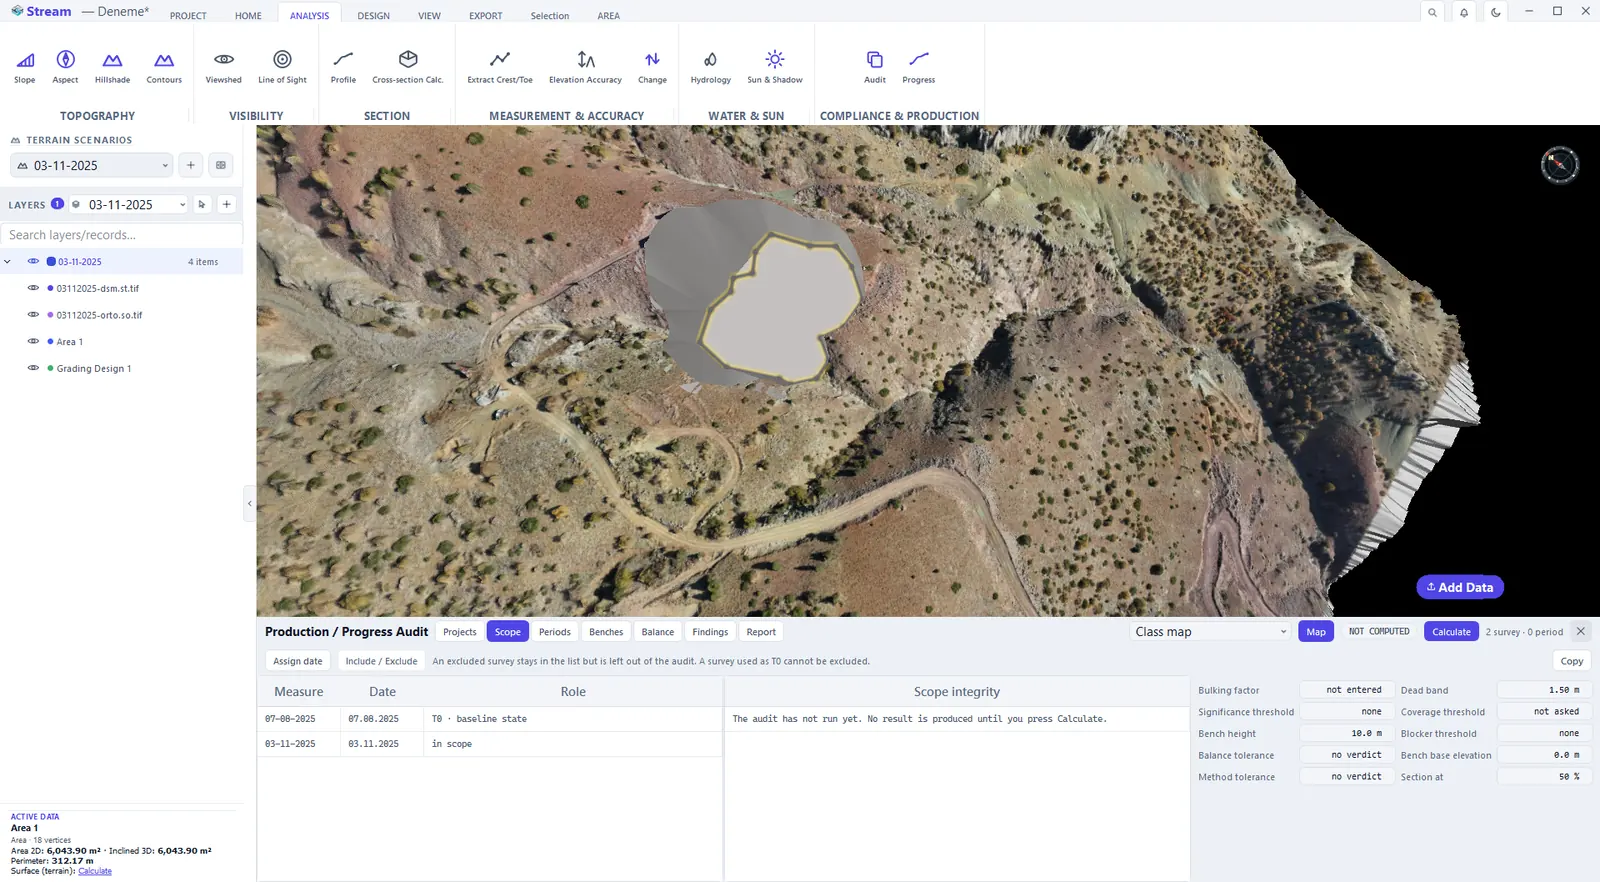
On the Scope tab, Assign date gives each survey scenario the date the survey was flown. STREAM suggests the date it finds in the file or scenario name — check it before pressing OK. Periods are built from consecutive dated surveys: an undated scenario that is part of the audit locks the report, while one you exclude does not. The thresholds on the right of the tab — dead band, significance and blocker thresholds, coverage threshold, bulking factor, balance tolerance, bench height — all start empty: STREAM never invents a threshold or a site measurement.
Scope lists the surveys of the project.
Give each survey its date.
Both surveys are now in scope.
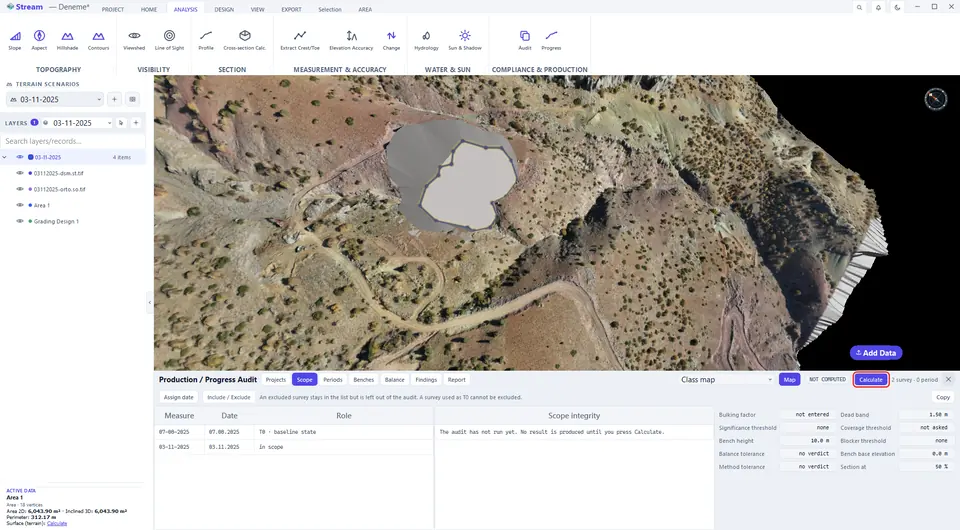
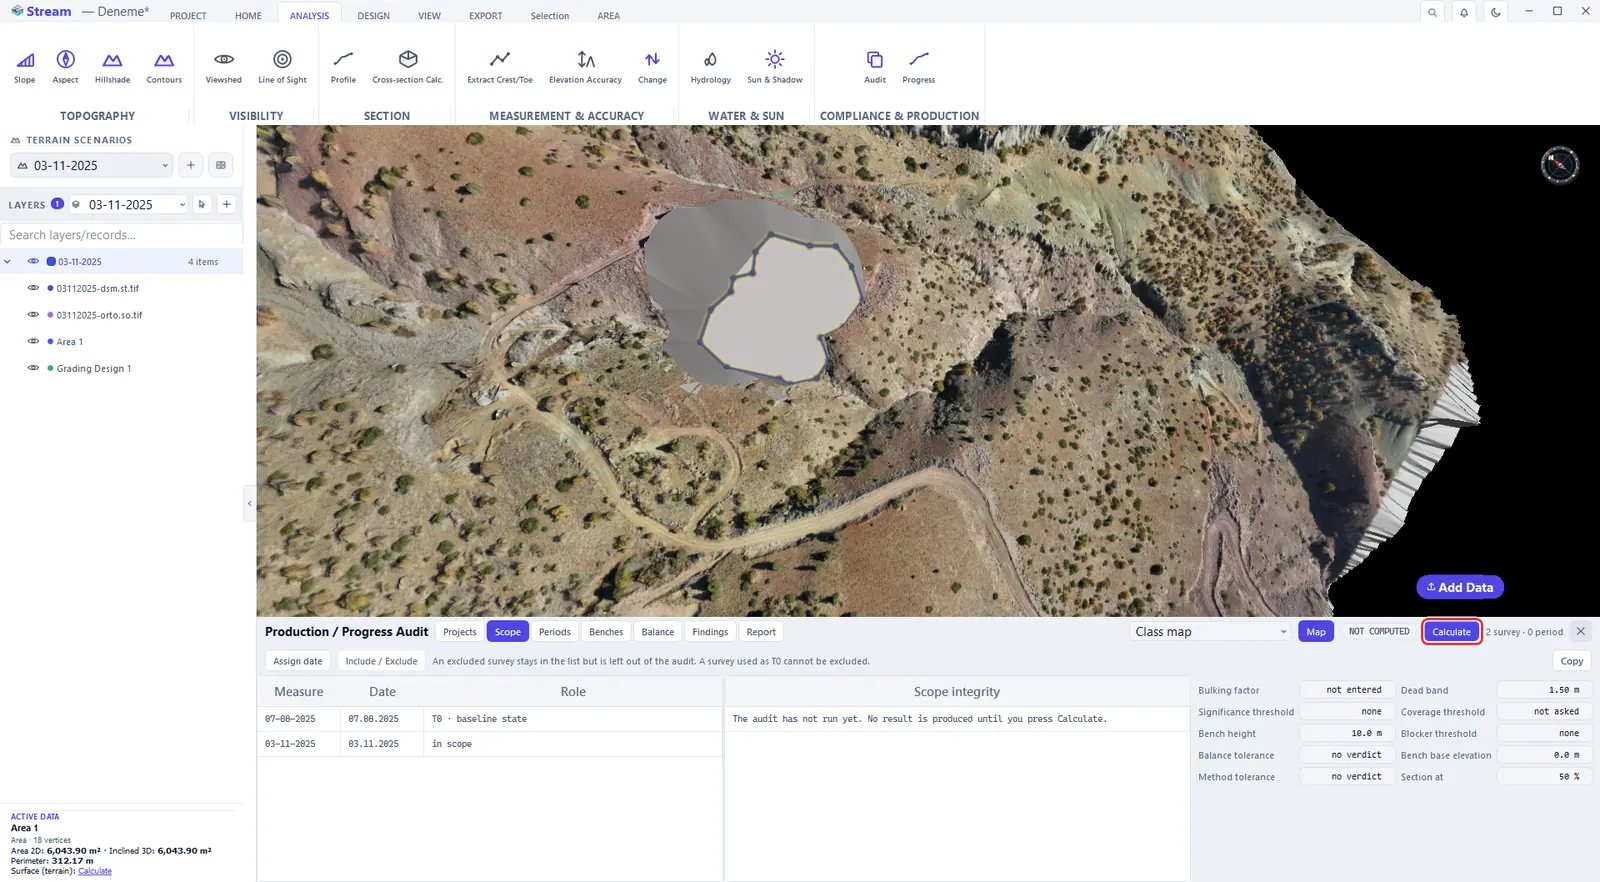
Press Calculate.
Read the results
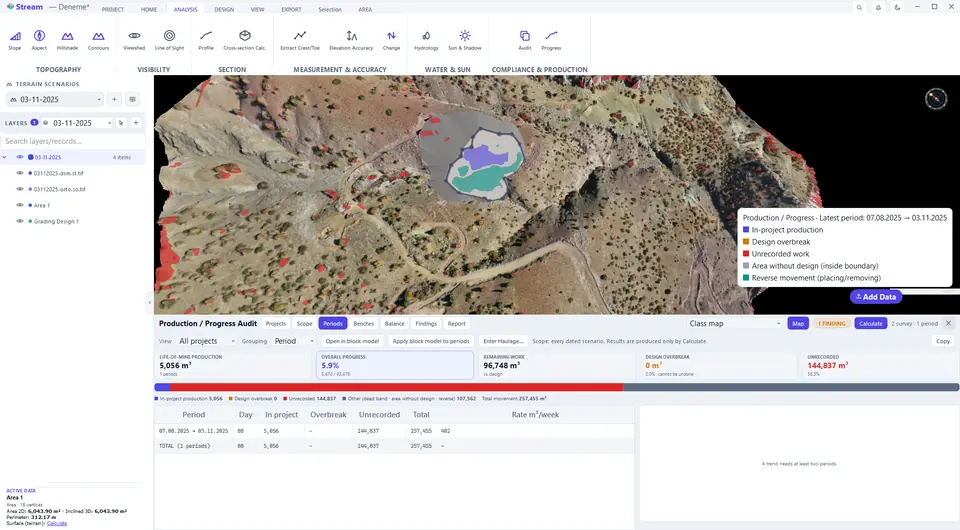
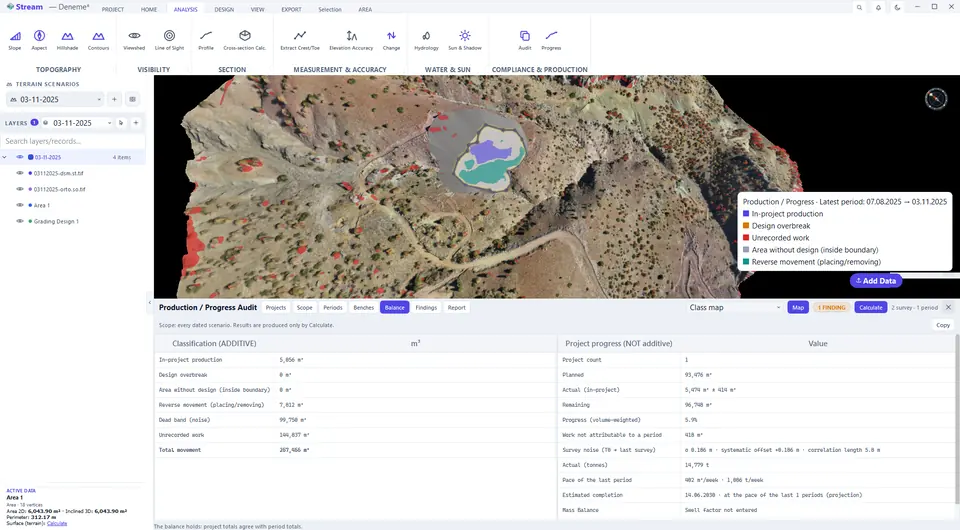
After Calculate, the map is painted with the classification of the last period — in-project production, design overbreak, unrecorded work, area without design and reverse movement — and the legend names each class.
Periods tab.
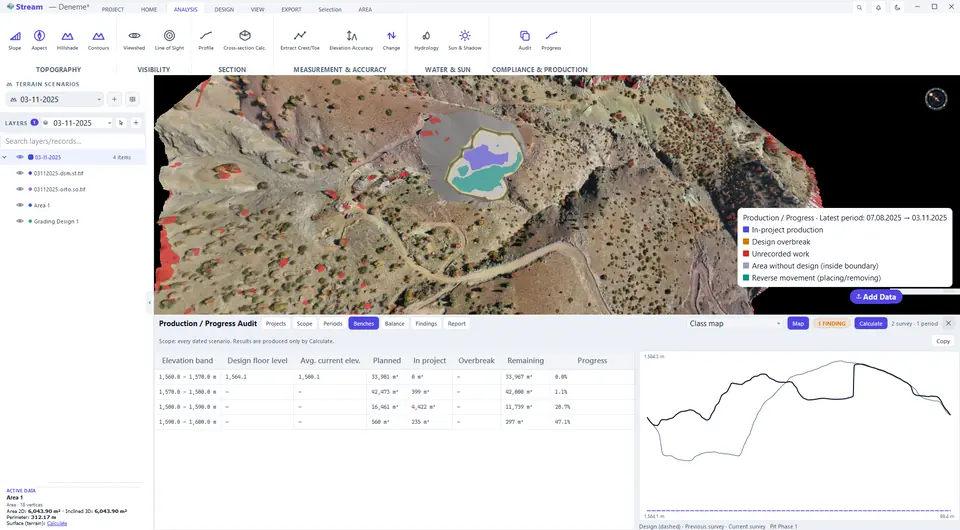
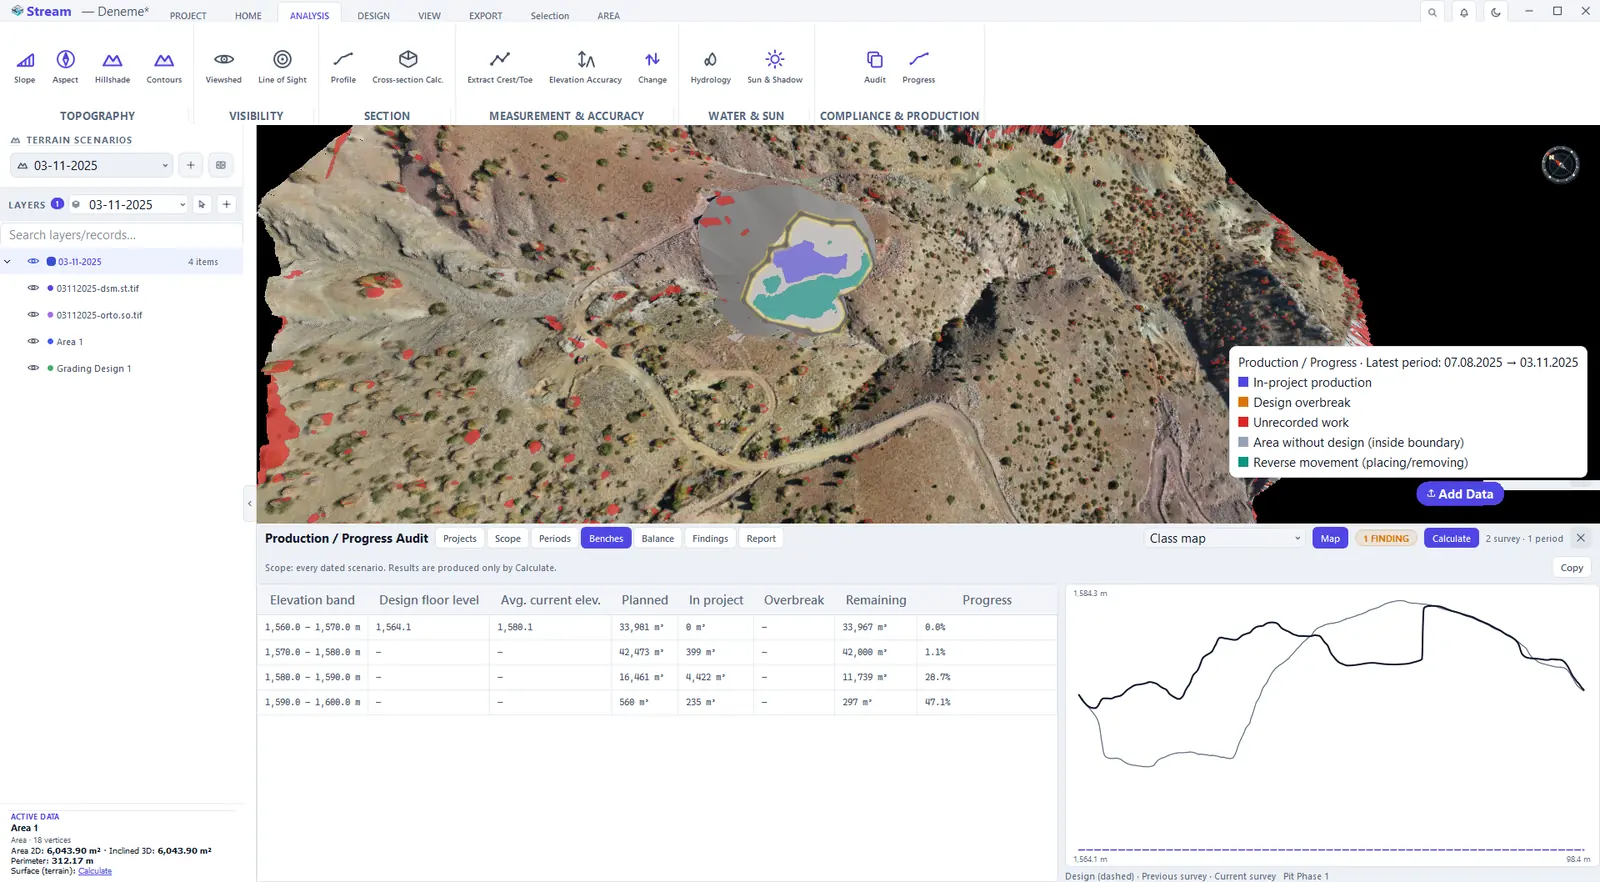
Benches tab.
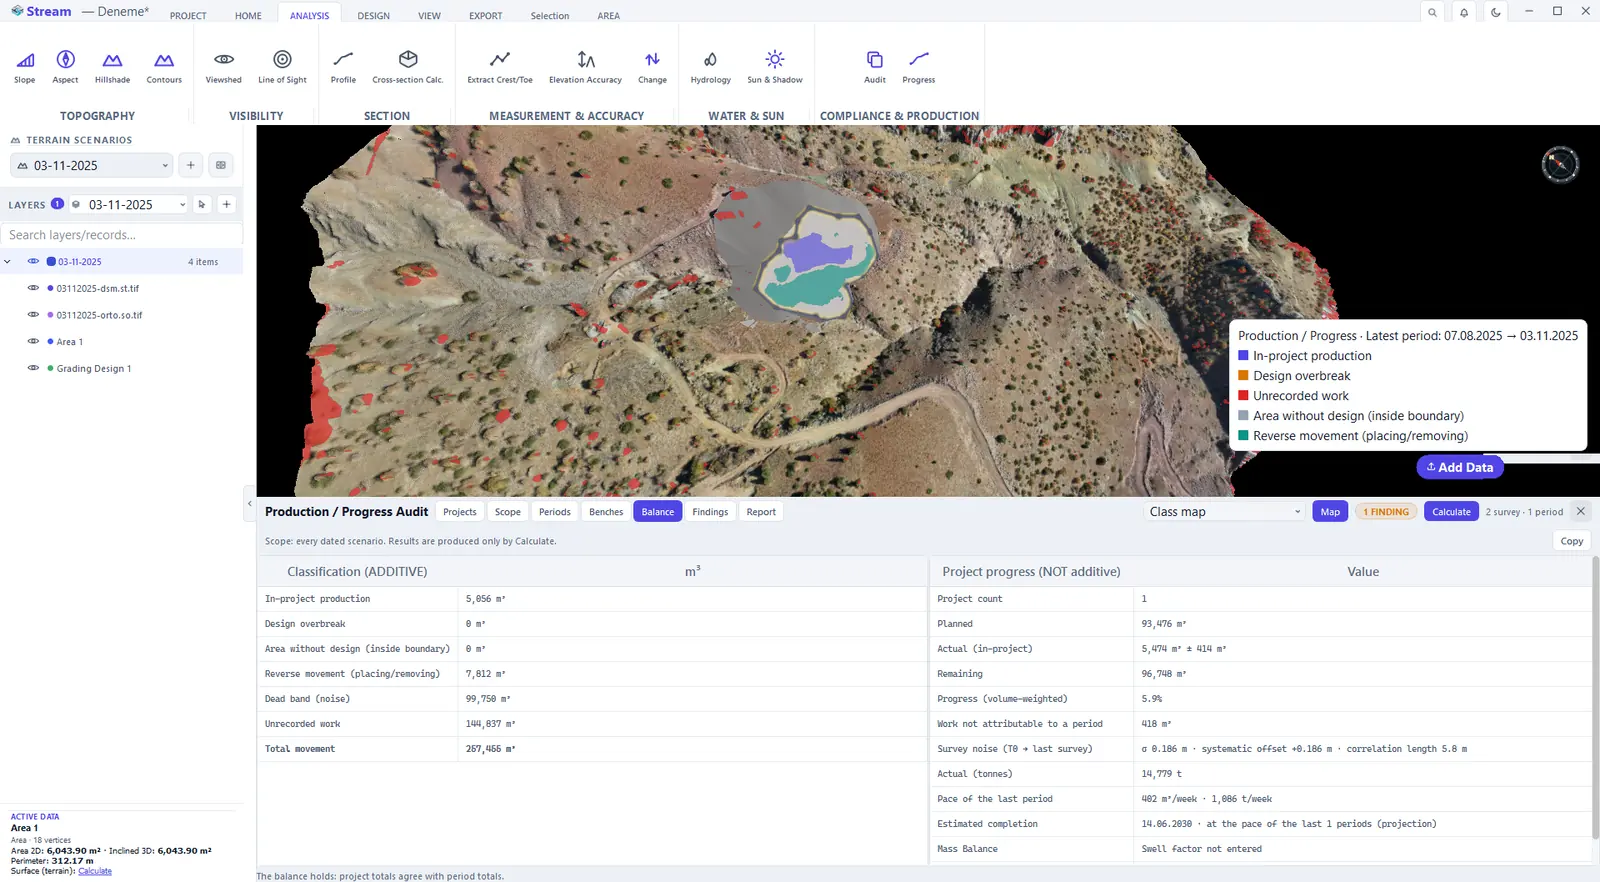
Balance tab.
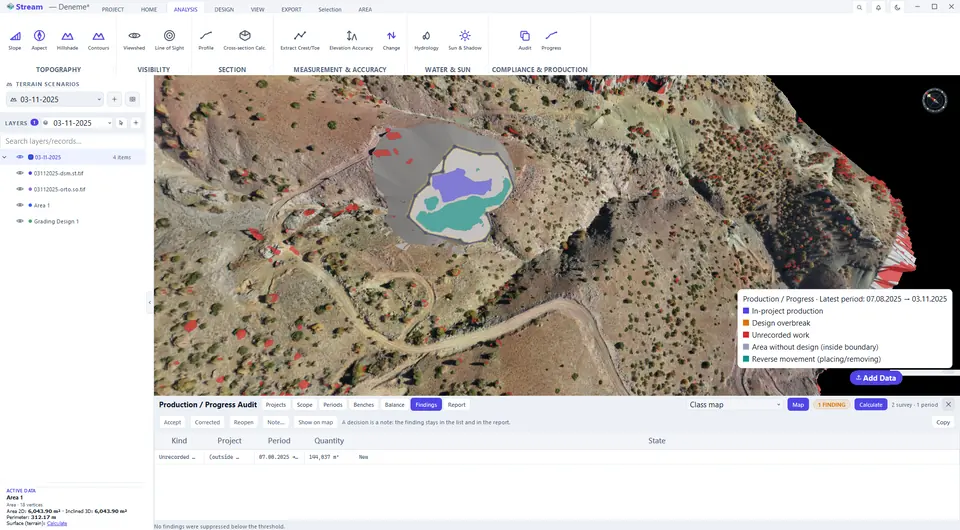
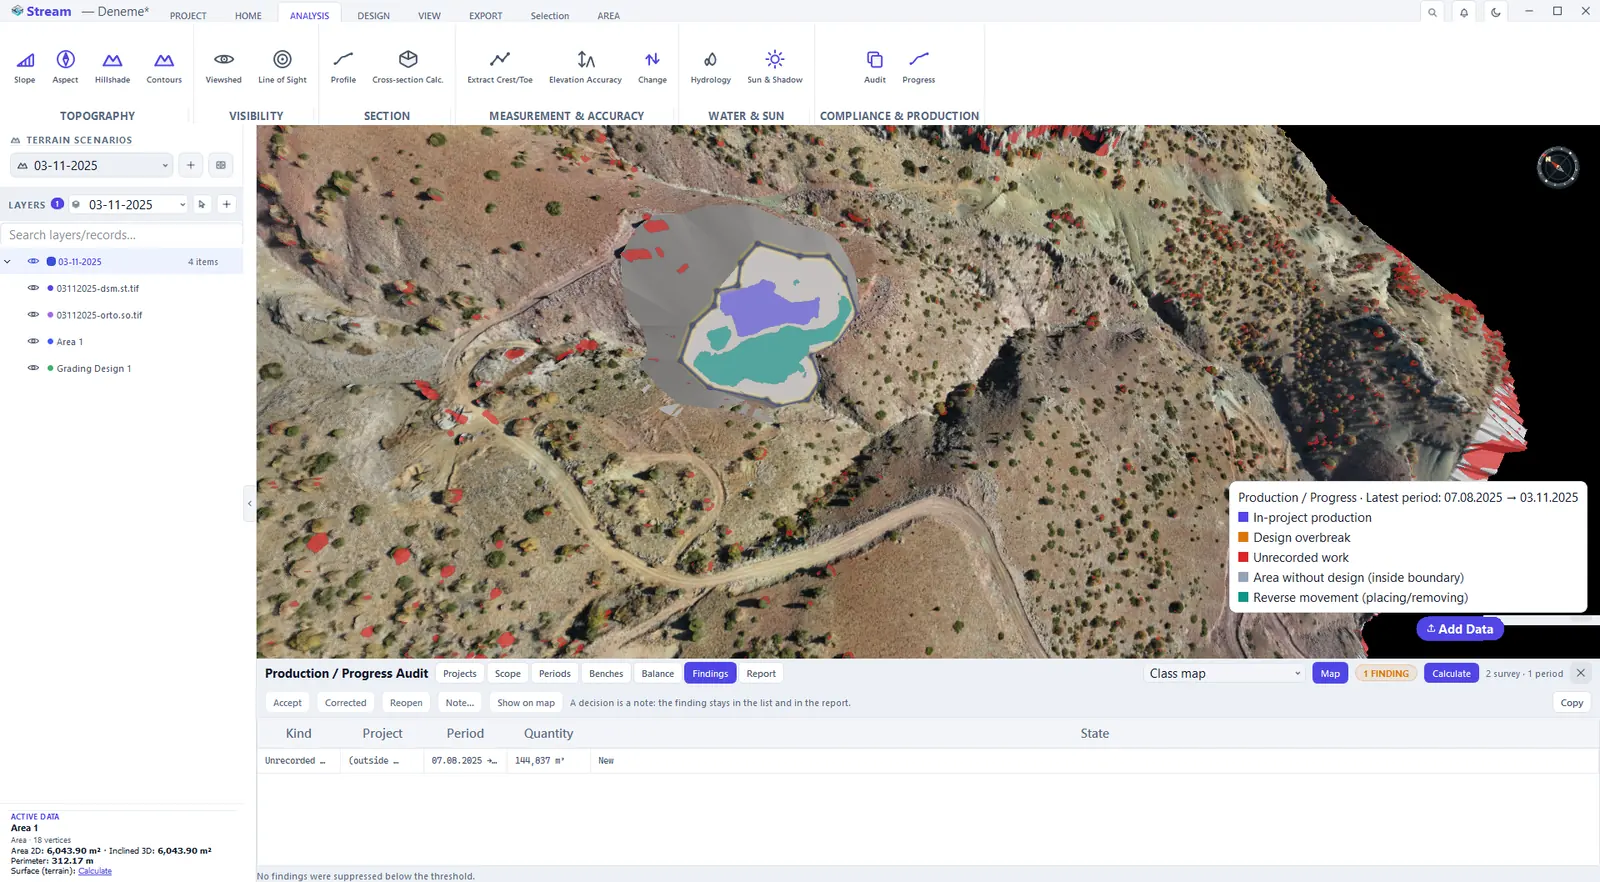
Findings tab.
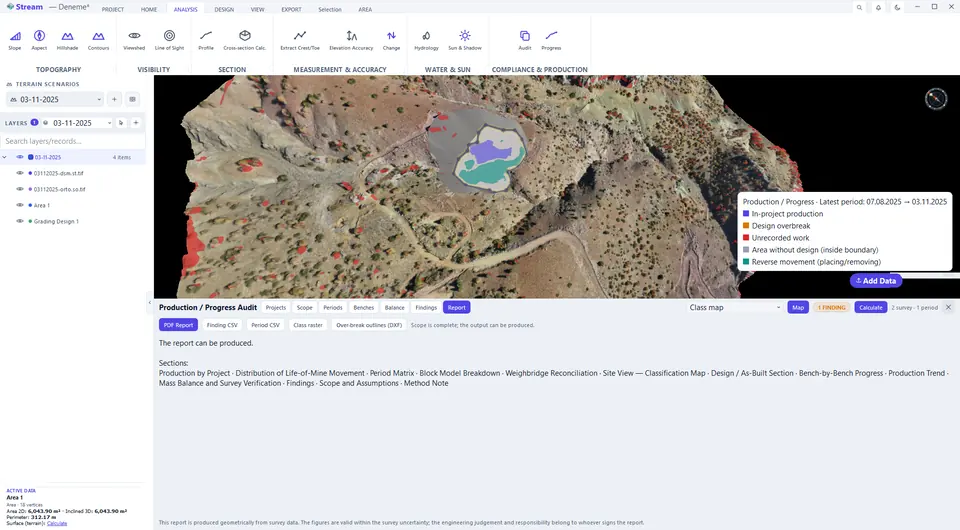
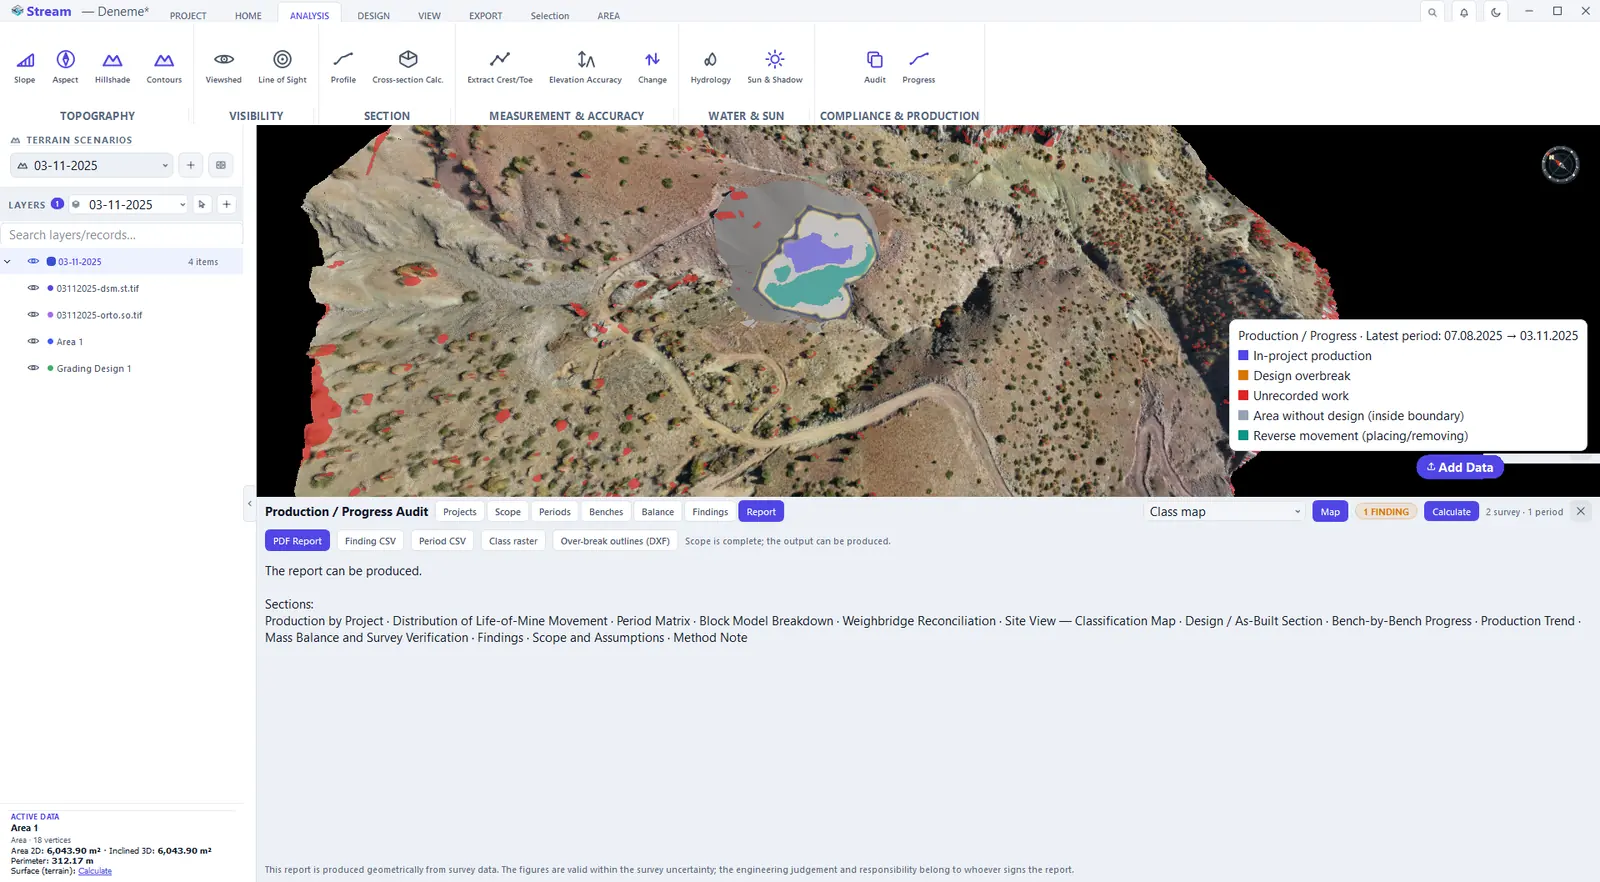
Report tab.
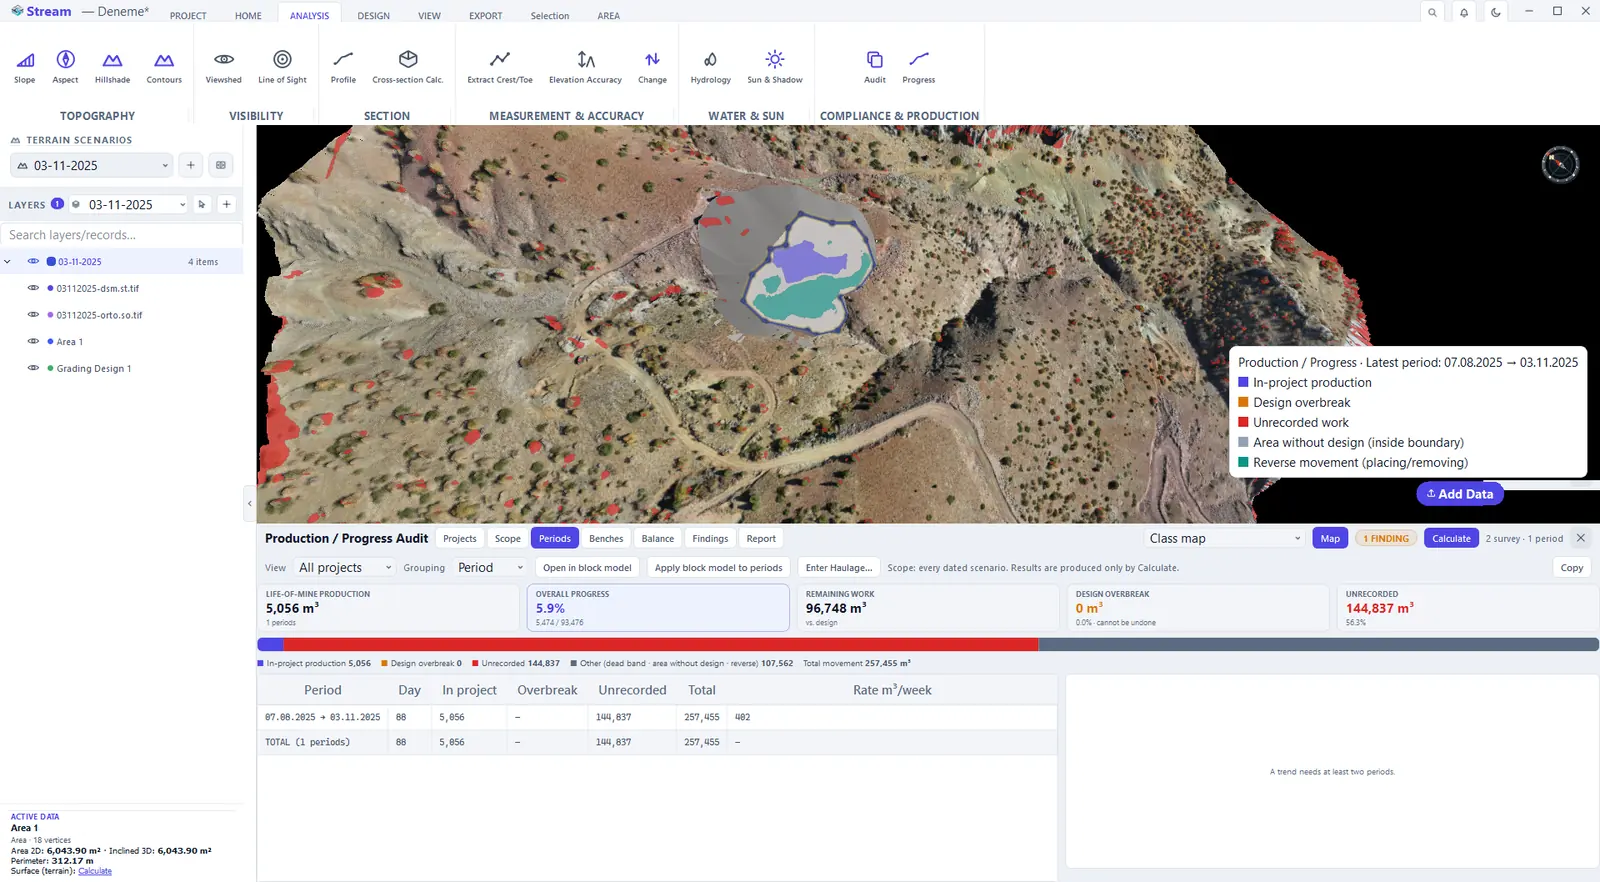
- Periods — a dashboard: life-of-mine production, overall progress, remaining work, design overbreak and unrecorded movement, then one row per period with the days, the in-project production, the overbreak, the unrecorded movement, the total and the weekly rate, ending with a total row. A production trend needs at least two periods.
- Benches — if a bench height is entered on the Scope tab: planned, in-project, overbreak, remaining and progress for each elevation band, beside the design and as-built section of the last period.
- Balance — the breakdown of total movement: in-project production, design overbreak, area without design, reversed movement, dead band (noise) and unrecorded work, next to planned, achieved, remaining and volume-weighted progress. Project totals and period totals are computed along two independent paths and must agree; if they do not, the panel shows the difference.
- Findings — design overbreak, area without design and unrecorded work, listed with project, period and quantity. Accept, Corrected and Reopen record a decision on the selected finding — it stays in the list and in the report — Note… adds a reason and Show on map moves the camera to it.
- Report — PDF Report, Finding CSV, a period CSV, a class raster and over-break outlines. If the scope is incomplete, the outputs are locked — not hidden — and the tab lists the reasons one by one; once the report can be produced it lists the document's sections, from the distribution of life-of-mine movement to the mass balance and the method note.
Next: Settings, shortcuts and help.
Related features
What each capability does, which formats it reads and writes, and answers to common questions: