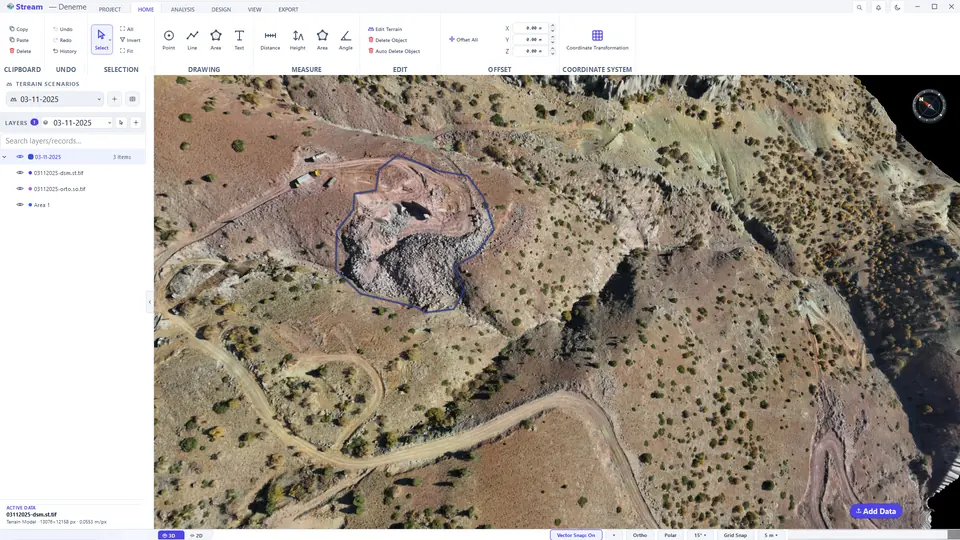
The STREAM window
The window is built from nine working areas. The second screenshot numbers them.
The main window with the Deneme project open.
Parts of the window: 1 ribbon tabs, 2 ribbon, 3 terrain scenarios, 4 layers, 5 view, 6 active data card, 7 status bar, 8 Add Data, 9 compass.
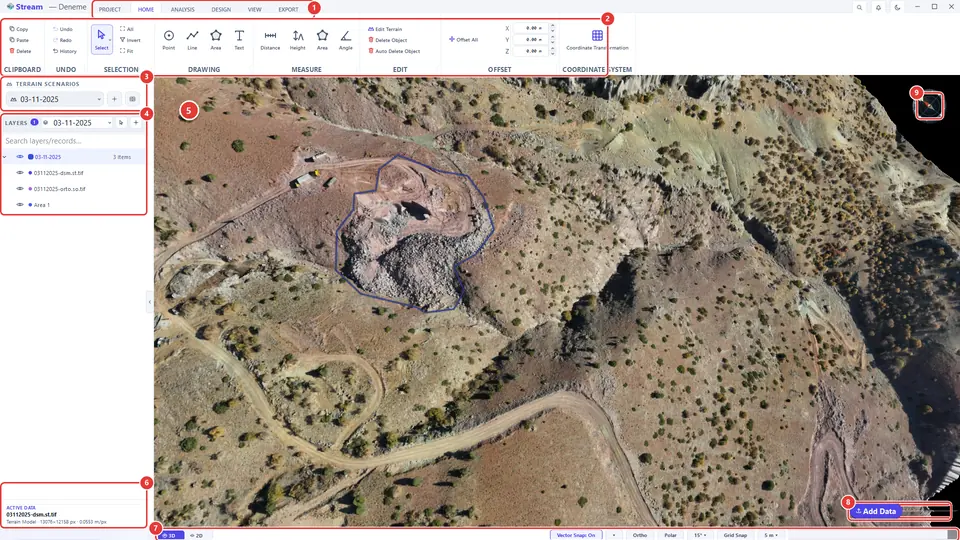
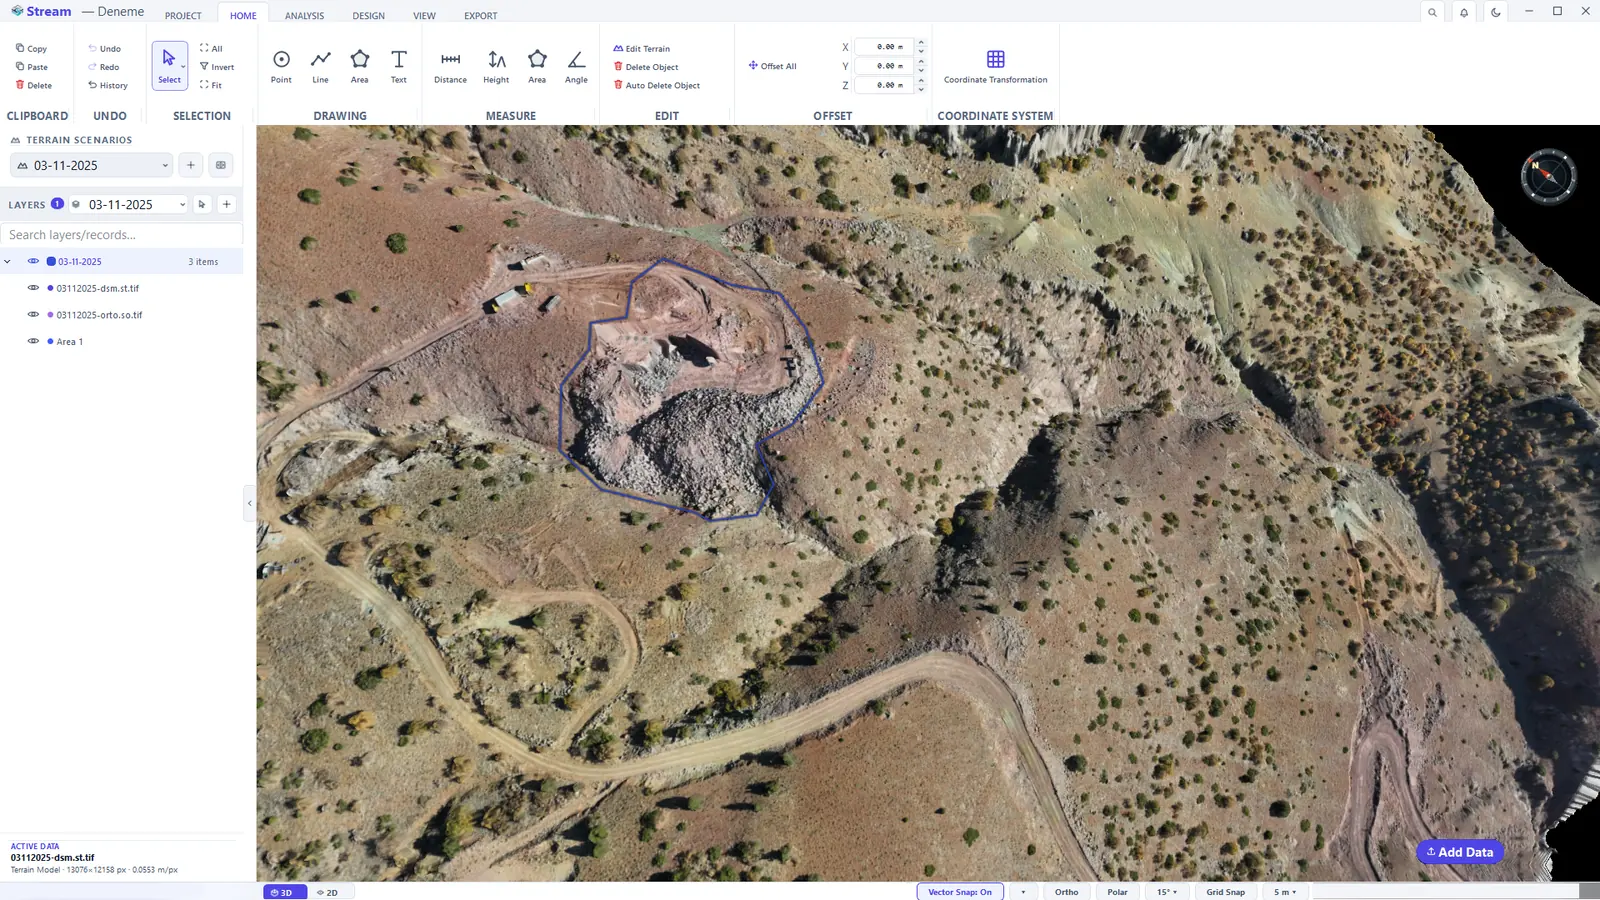
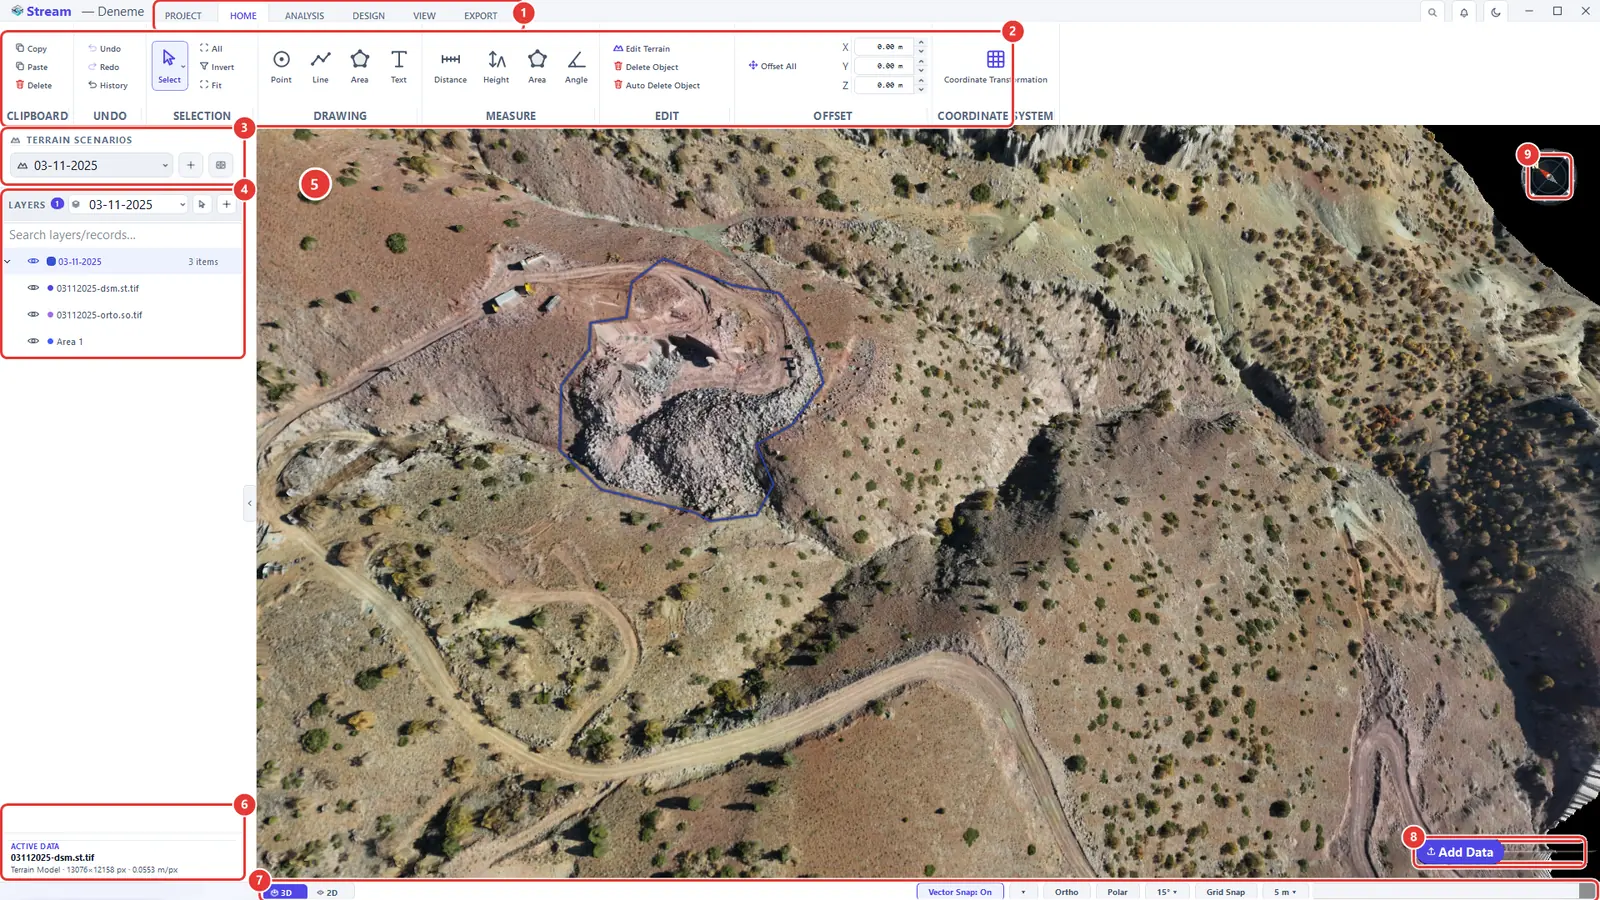
- Ribbon tabs — PROJECT, HOME, ANALYSIS, DESIGN, VIEW and EXPORT. When you select an object or start an analysis, a context tab for it (for example AREA, LINE or SLOPE) appears at the end of the row.
- Ribbon — the tools of the active tab, grouped under a title (DRAWING, MEASURE, EDIT …).
- TERRAIN SCENARIOS — the surveys of the same site kept side by side; the list switches between them.
- LAYERS — every dataset, drawing and analysis result of the active scenario, with an eye icon to show or hide each one.
- 3D view — the terrain itself. This is where you navigate, draw and click.
- ACTIVE DATA — live numbers for whatever is selected or being measured: lengths, areas, volumes.
- Status bar — the 3D / 2D switch and the snapping switches (Vector Snap, Ortho, Polar, Grid Snap). On your own screen it also shows the project coordinate system on the left and the cursor coordinates on the right.
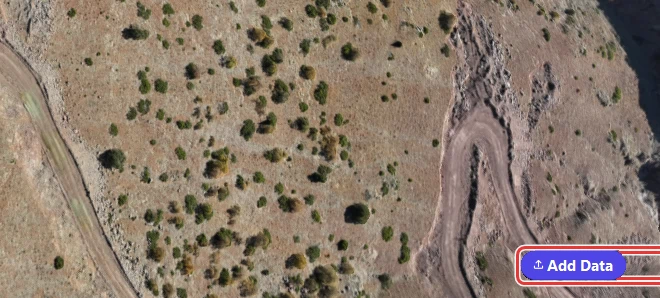
- Add Data — loads terrain, imagery, point clouds and CAD files into the project.
- Compass — shows where north is; double-click it for a north-up, top-down view.
The Home screen
When STREAM starts, the Home screen is the first thing you see. Click the Stream brand at the top-left of the window to bring it back at any time.
The Home screen.
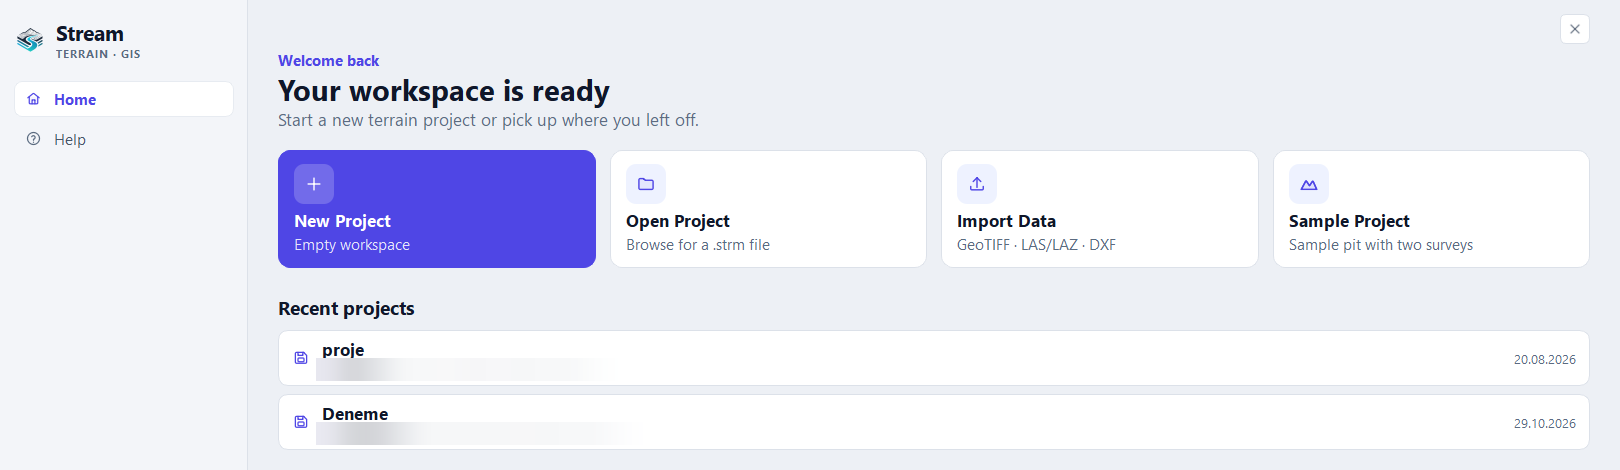
- Choose one of the cards: New Project (an empty workspace), Open Project (browse for a saved
.strmproject file), Import Data (GeoTIFF, LAS/LAZ, DXF and more — several files can be picked at once) or Sample Project.- Sample Project opens a small generated pit surveyed on two dates, so every tool can be tried without data of your own. It is not a real site.
- Or click a row under Recent projects to continue where you left off.
- Help, Settings and About on the left are pages of this same screen, not separate windows.
- Back to workspace at the top-right returns to the map. Esc does the same.
Open, save and close a project
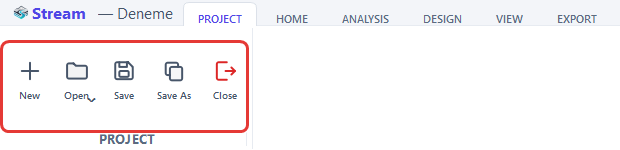
The PROJECT tab manages project files.
New, Open, Save and Save As on the Project tab.
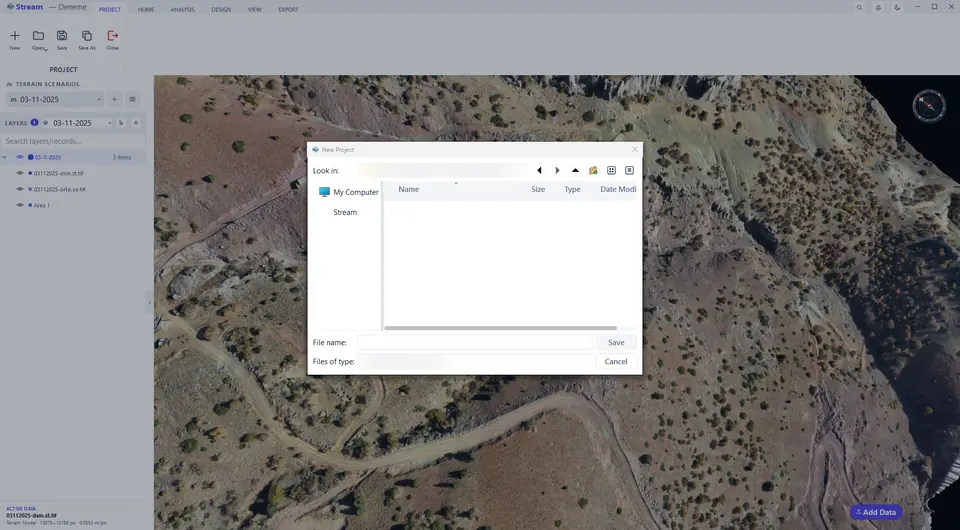
Save the project under a new name.
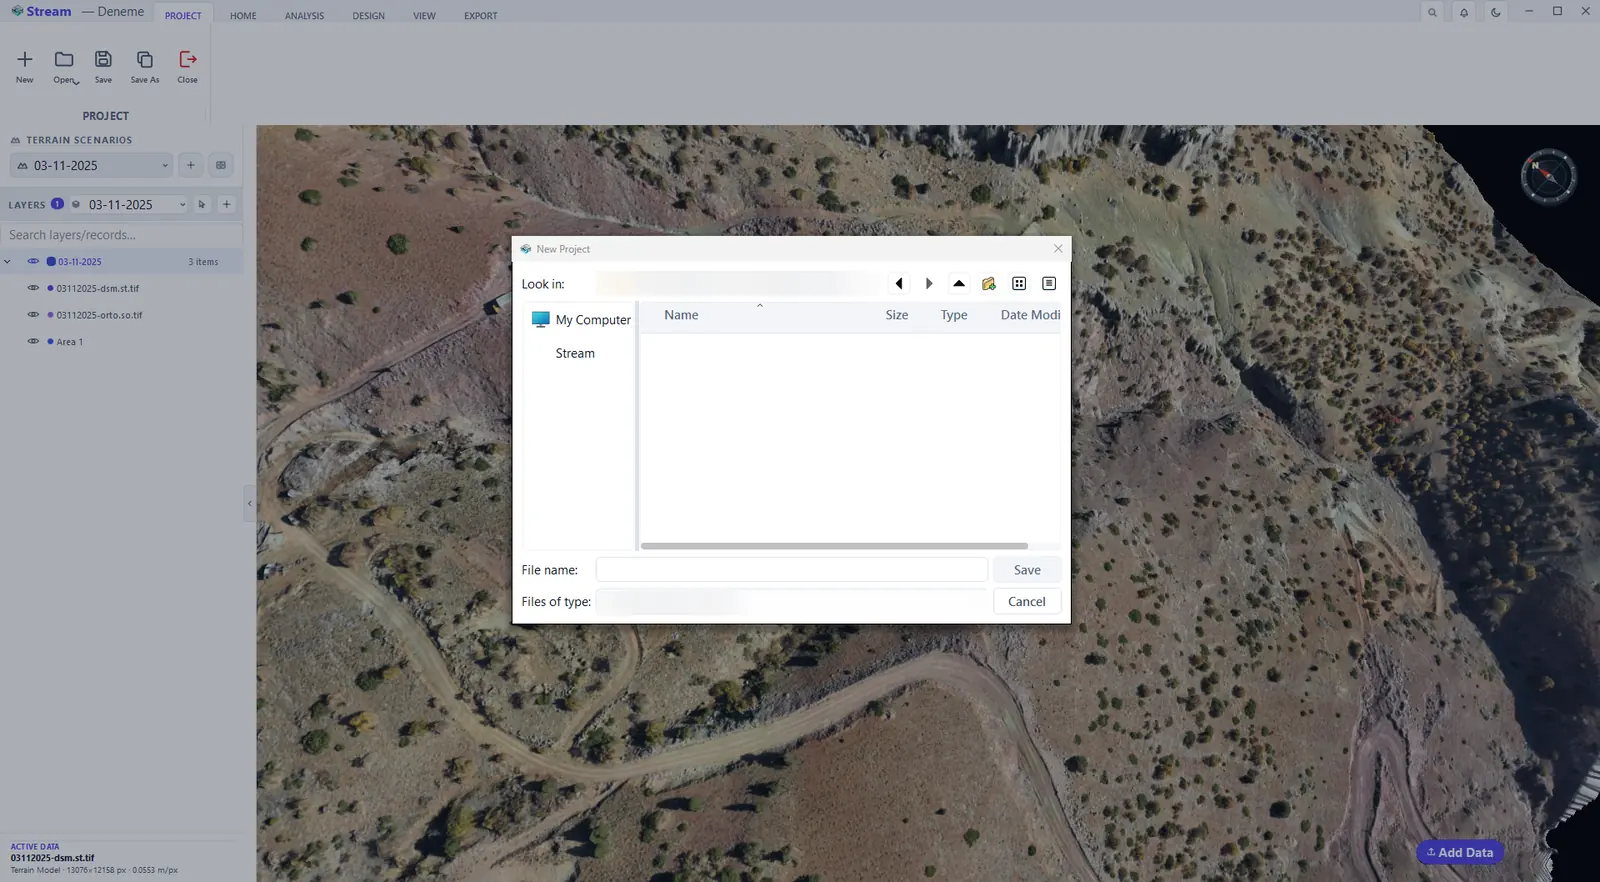
- New starts an empty project. Open opens a saved one; the arrow on the button lists the recent projects.
- Save writes all layers, drawings, measurements and terrain scenarios into one project file. Save As writes a copy under a new name.
- Close closes the project and returns to the Home screen.
- Shortcuts: Ctrl+N new · Ctrl+O open · Ctrl+S save · Ctrl+Shift+S save as.
The Home tab
The HOME tab holds the tools you use most: clipboard and undo, selection, the DRAWING group (Point, Line, Area, Text), the MEASURE group (Distance, Height, Area, Angle), EDIT and OFFSET, and Coordinate Transformation.
Drawing and measuring tools on the Home tab.

The drawing tools are described in Points, Lines, Areas and Text, selection and transform; the measure tools in Measure.
Find any tool with command search
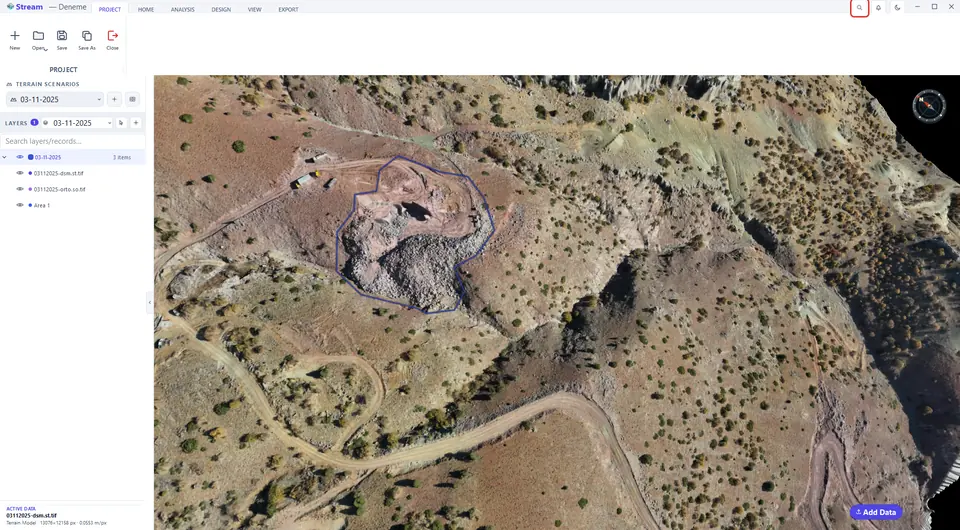
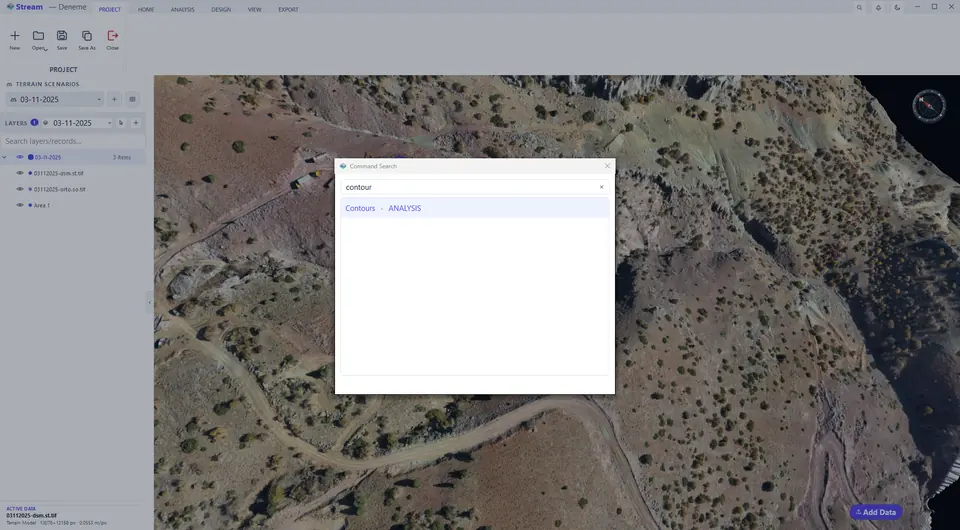
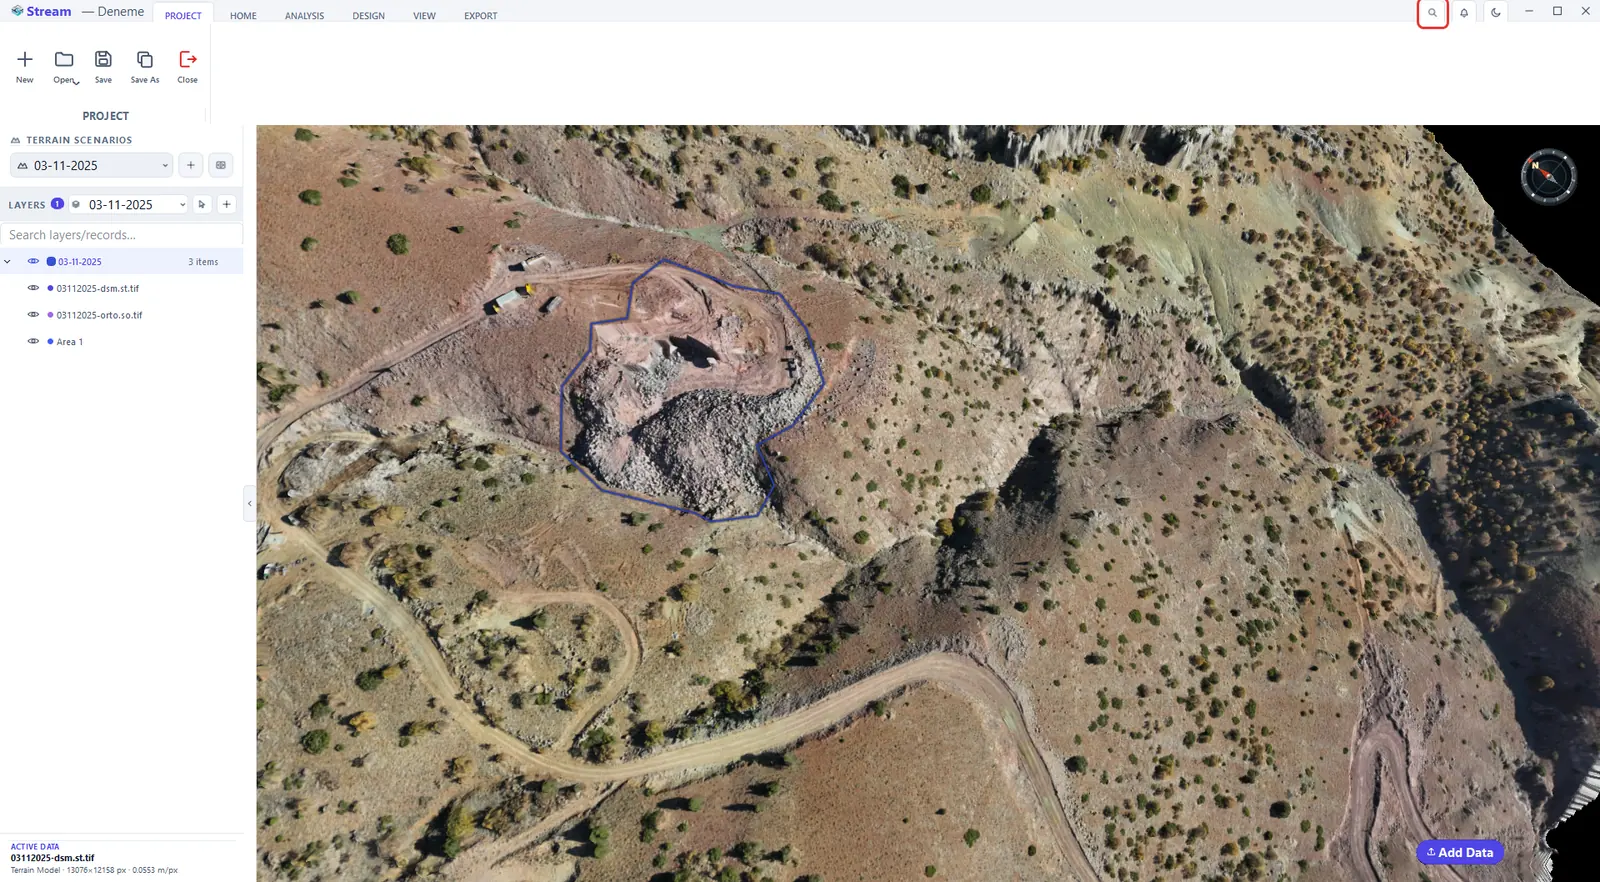
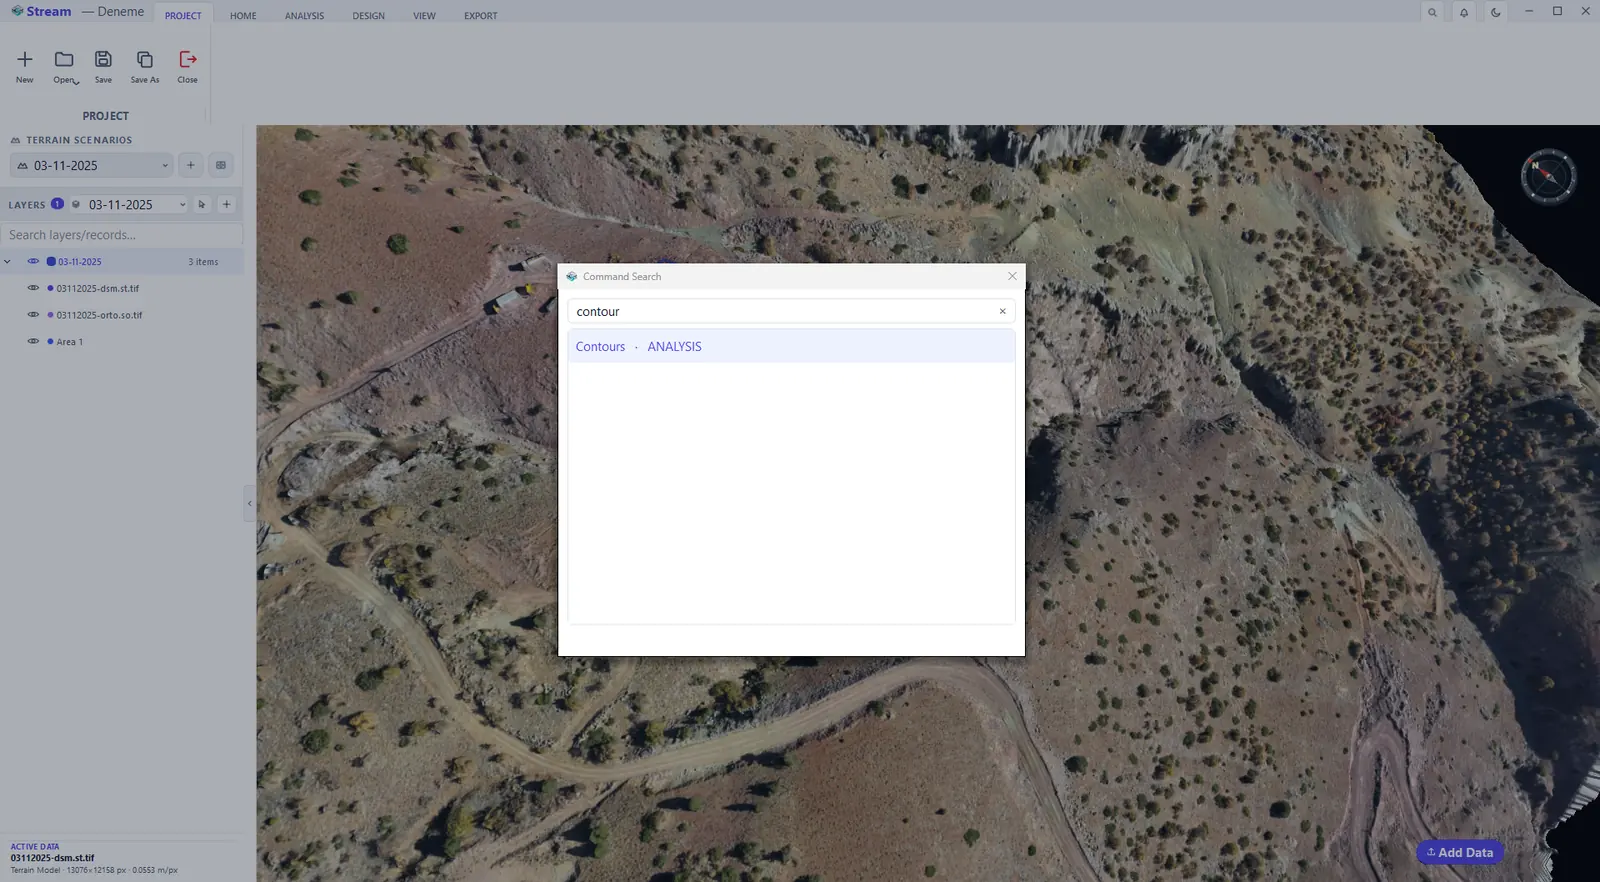
You do not have to remember which tab a tool lives on. Press Ctrl+K, or click the search icon at the top right of the window, type part of a tool's name — contour, for example — and press Enter: STREAM shows the matching ribbon tools with the tab each one belongs to and runs the one you choose.
Press Ctrl+K or the search icon.
Type a tool name and press Enter.
Add data: DEM, orthophoto, point cloud and CAD
The Add Data button sits at the bottom-right corner of the 3D view (shortcut L).
Add Data button in the viewport.
- Click Add Data.
- Pick one or more files. STREAM reads:
- DEM (GeoTIFF) — elevation data; this builds the 3D terrain.
- Orthophoto (GeoTIFF) — an aerial image draped over the terrain.
- Point cloud (LAS / LAZ) — you choose whether a DEM is built from the ground points or from all points, and whether an orthophoto is made from the point colours.
- CAD drawing (DXF), LandXML, SHP / GeoJSON / GPKG — vectors become editable points, lines and areas.
- Each file is prepared in a card at the bottom-right of the view. When the card says the data is ready, press Add to put it into the project, or Cancel to discard it.
- The new dataset appears as a row in LAYERS.
The point cloud import has its own step-by-step walkthrough in Engineering tools; to bring in a CSV point list see Points.
Next: Navigate the terrain.
Related features
What each capability does, which formats it reads and writes, and answers to common questions: