
Slope
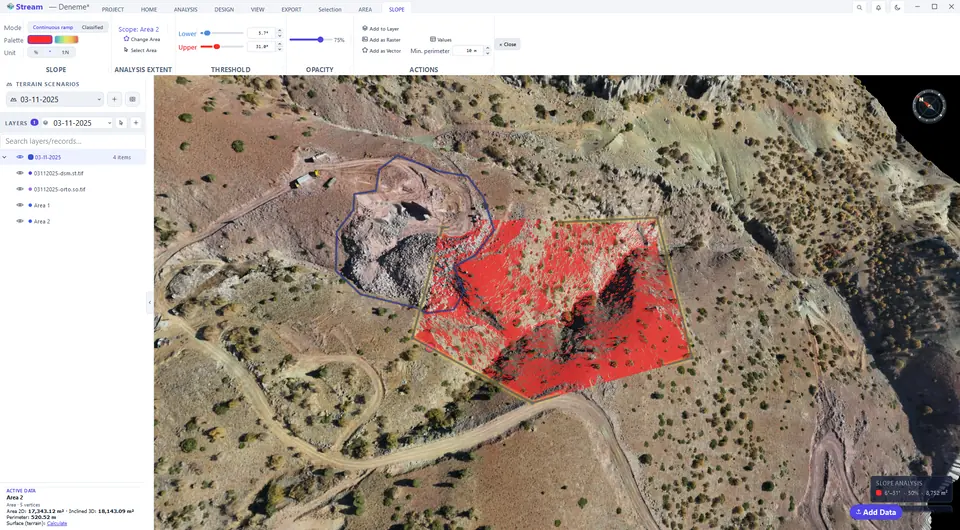
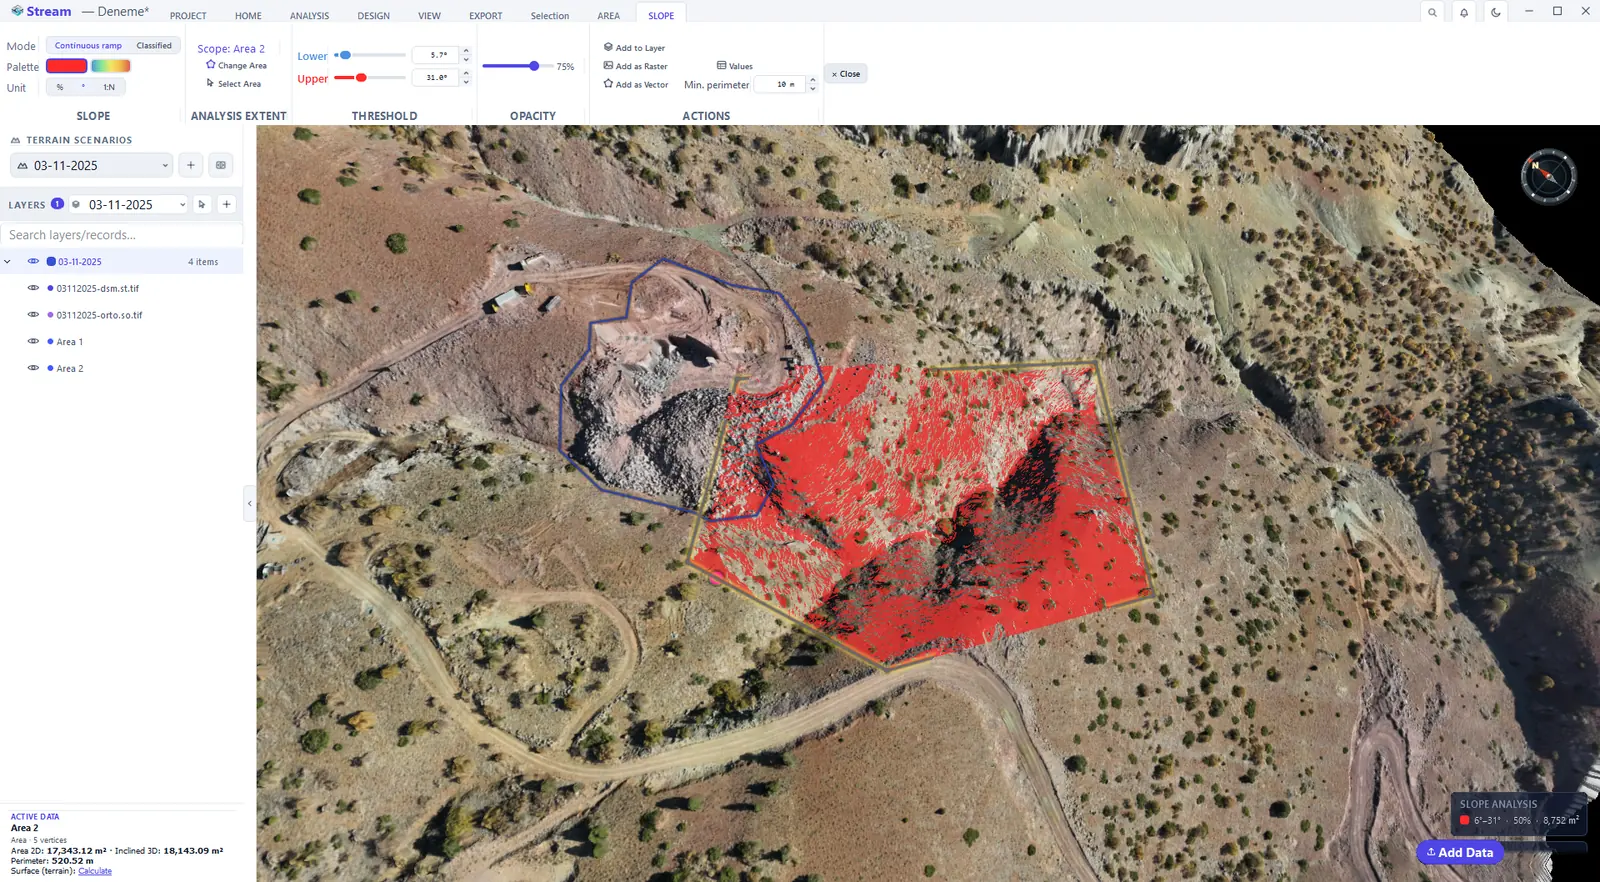
Select an area and click ANALYSIS ▸ TOPOGRAPHY ▸ Slope. Everything between the Lower and Upper threshold is painted — for example everything steeper than the angle a machine can work on. Unit switches between percent (%), degrees (°) and ratio (1:N); Palette chooses a single colour or a rainbow ramp.
Slope controls on the ribbon.

Slope map result.
Classified slope result.
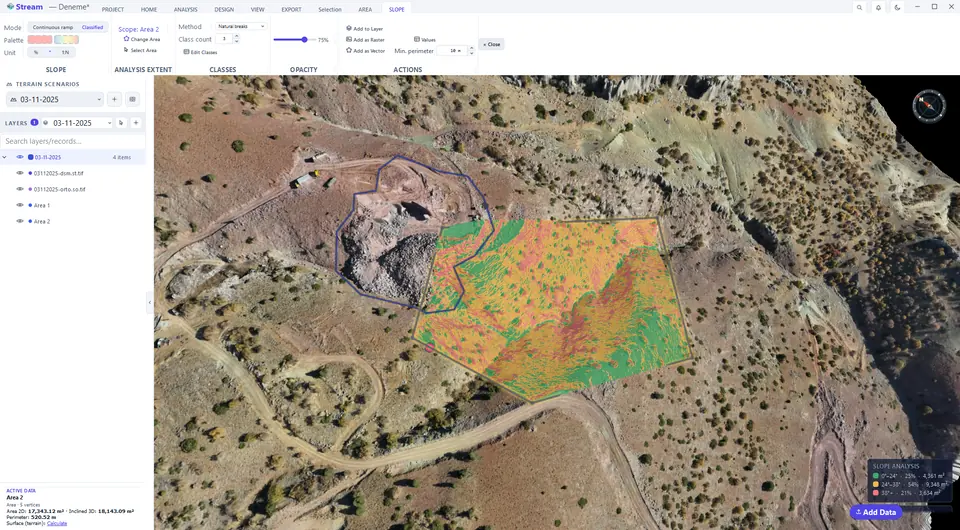
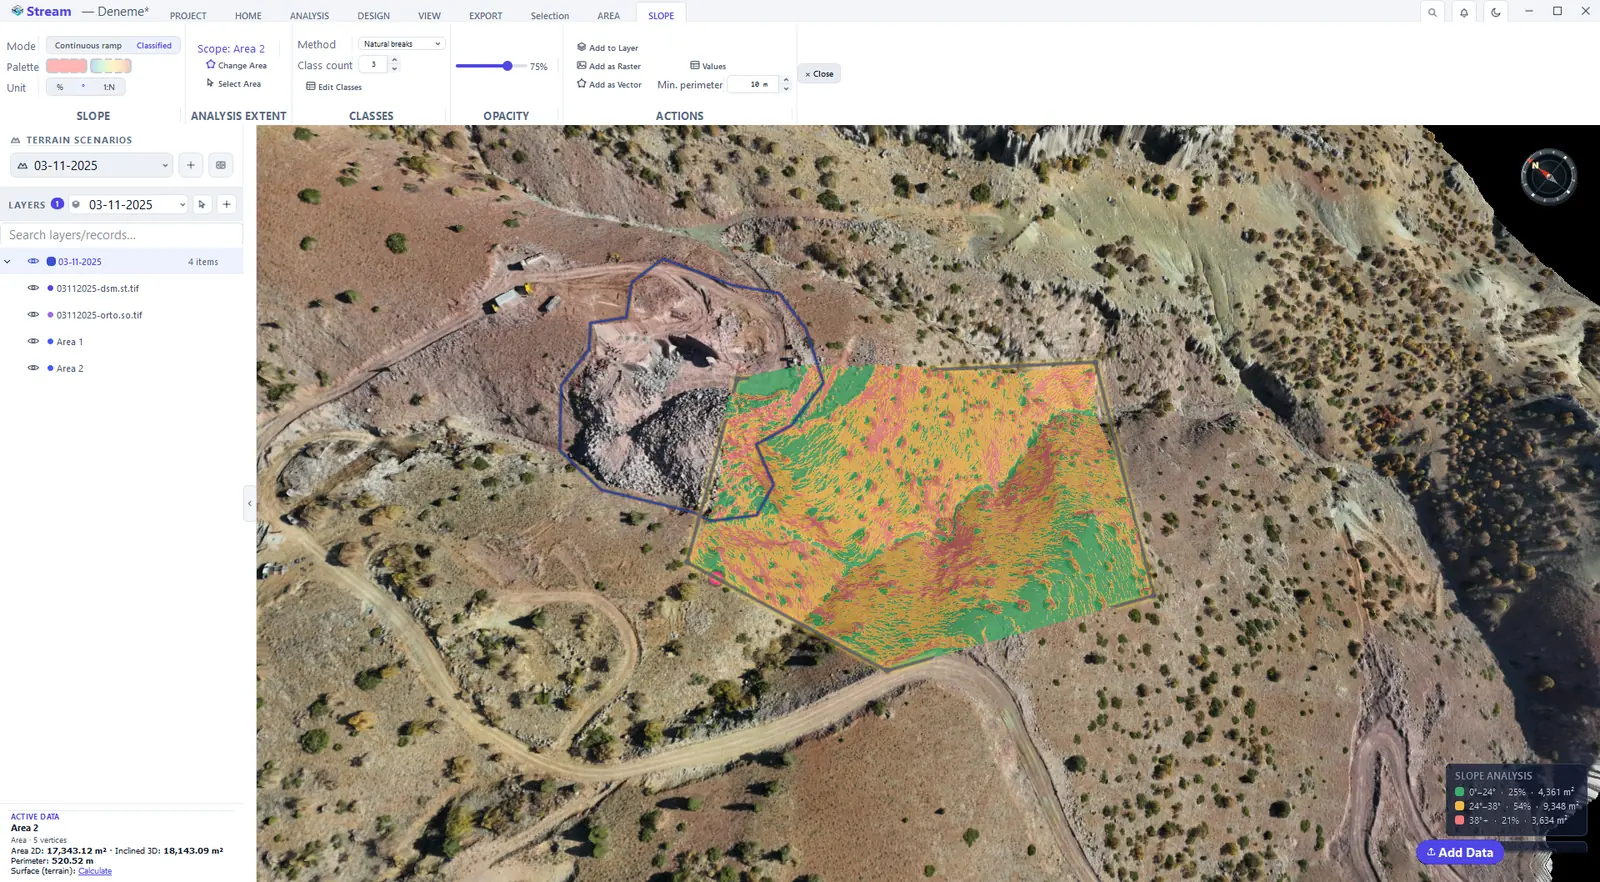
Switch Mode to Classified to split the area into slope classes instead of a continuous ramp; the legend in the corner of the view names the classes.
Aspect
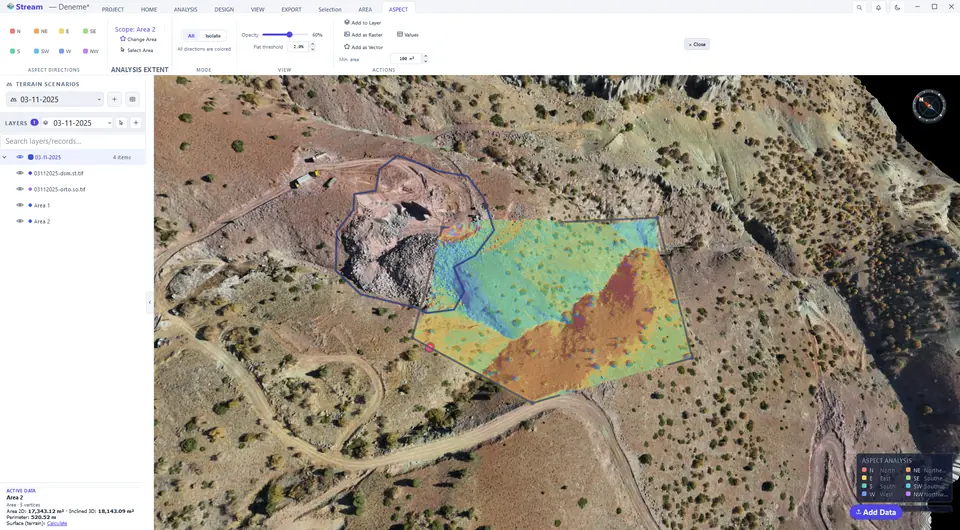
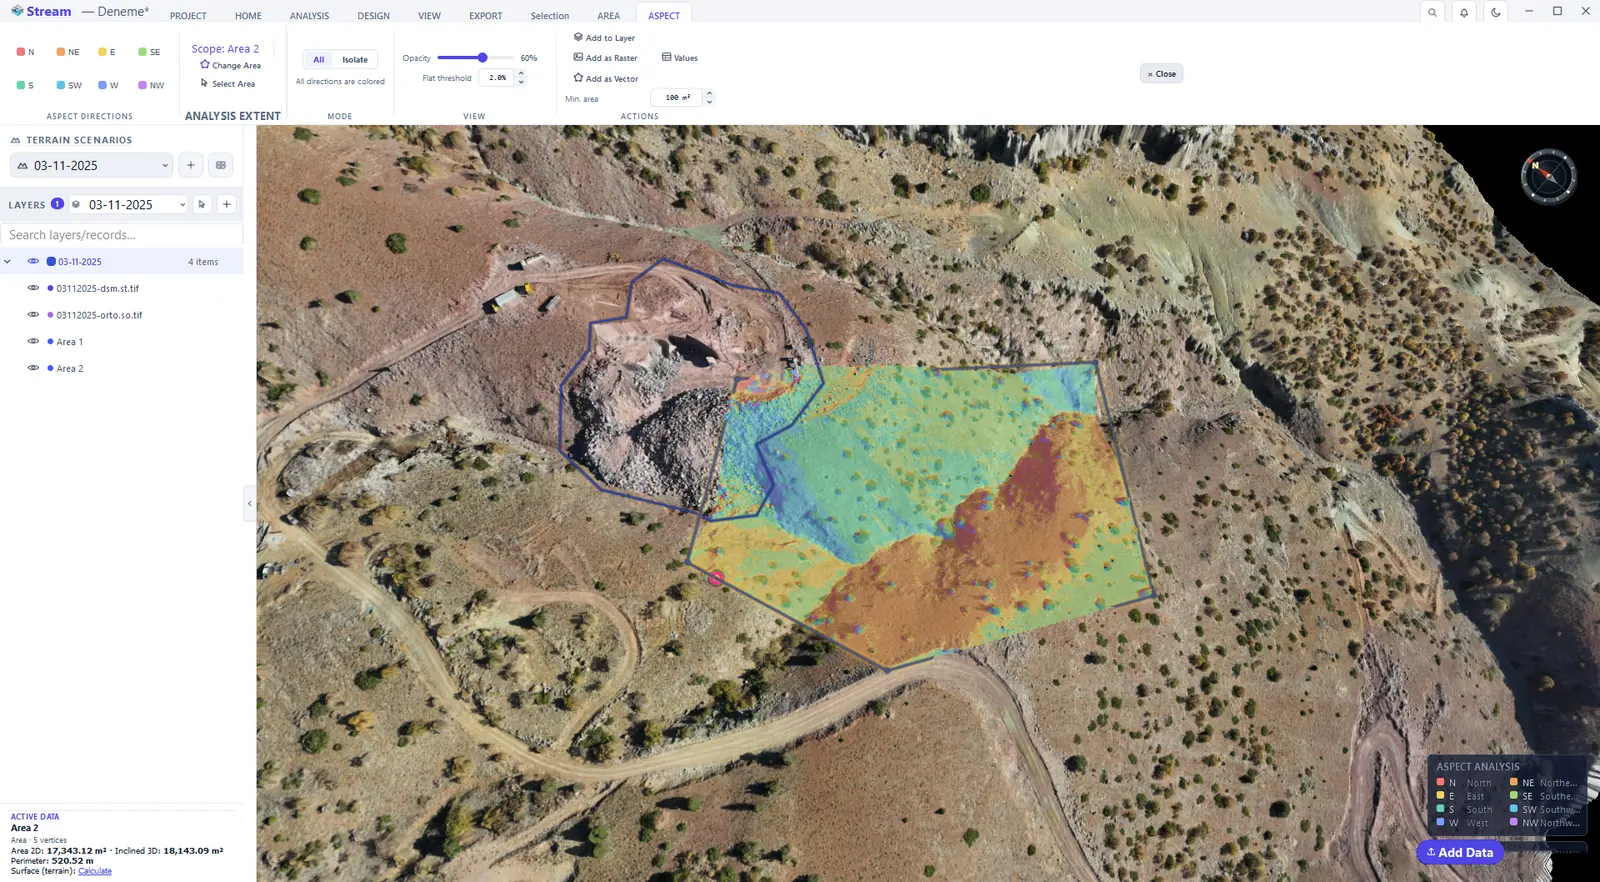
Aspect colours the direction each slope faces. Click one of the eight direction buttons (N, NE, E …) and choose Isolate to show a single direction — the north-facing ground that keeps snow, or the faces that get the afternoon sun.
Aspect map result.
Contours
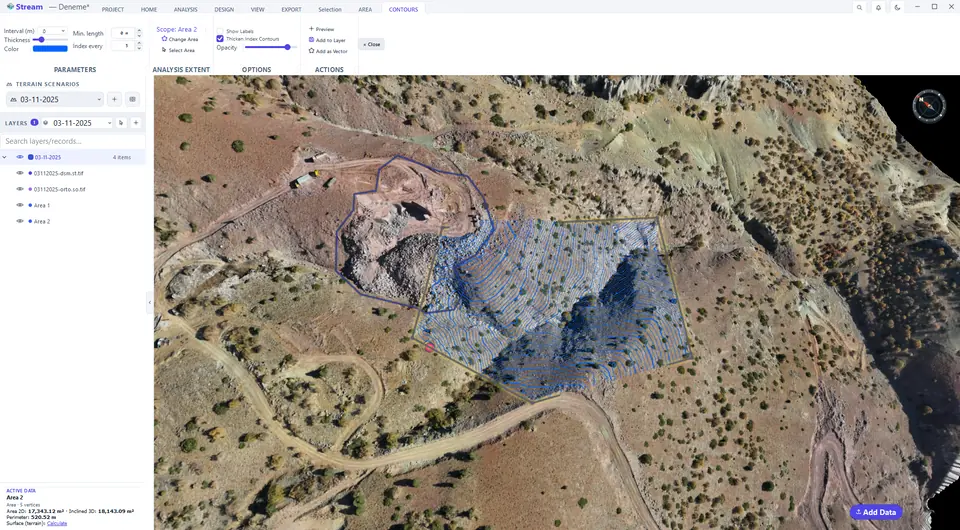
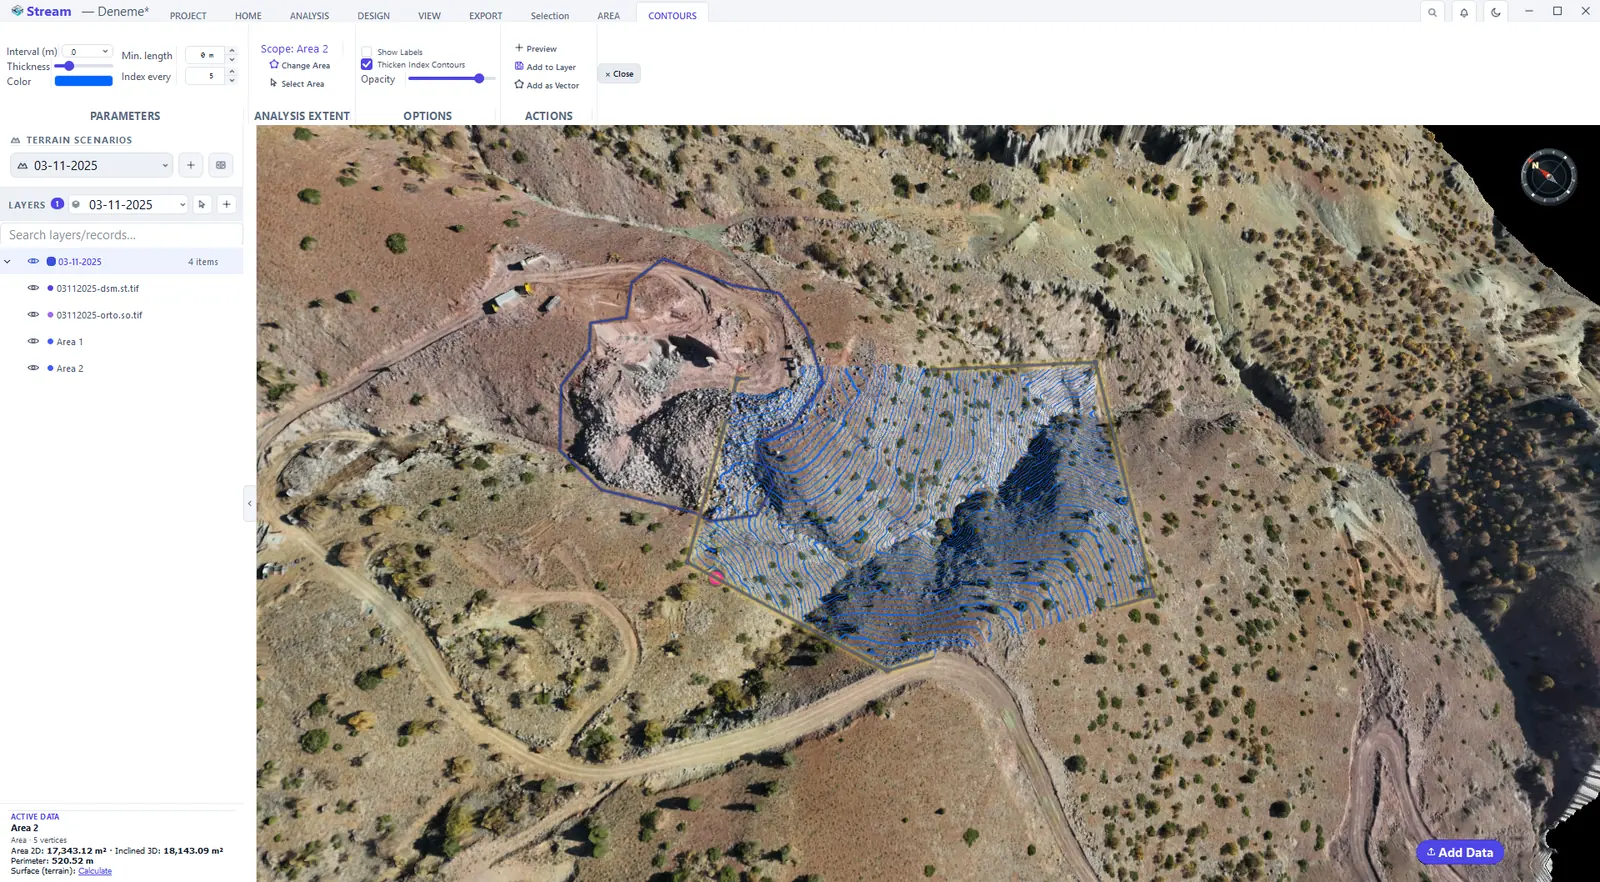
Select an area and click ANALYSIS ▸ TOPOGRAPHY ▸ Contours. Contour lines are drawn inside the area straight away. Set the Interval (m), the line Thickness and Color; Index every and Thicken Index Contours draw every fifth line heavier, Show Labels writes the elevations. Add to Layer keeps the contours in the project; Add as Vector turns them into lines you can save to DXF for CAD.
Contour controls on the ribbon.

Contours over the terrain.
Hillshade
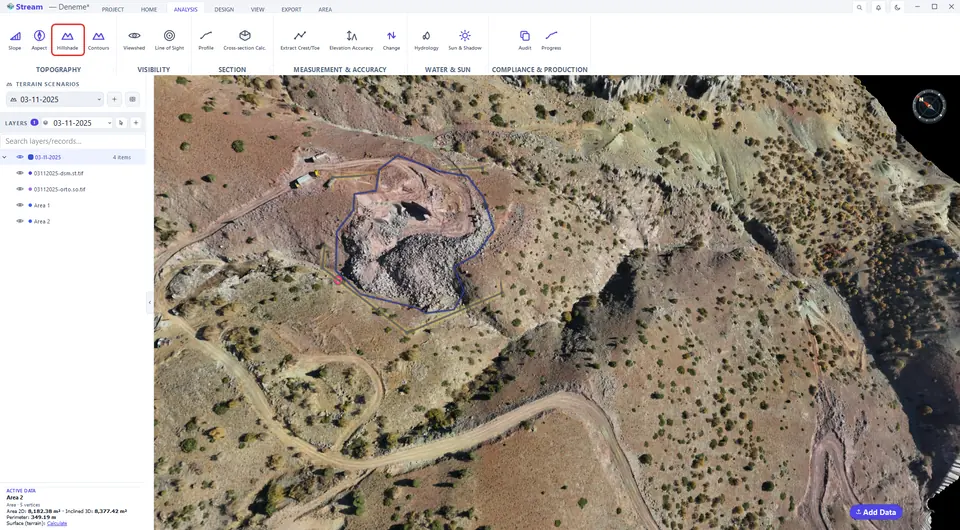
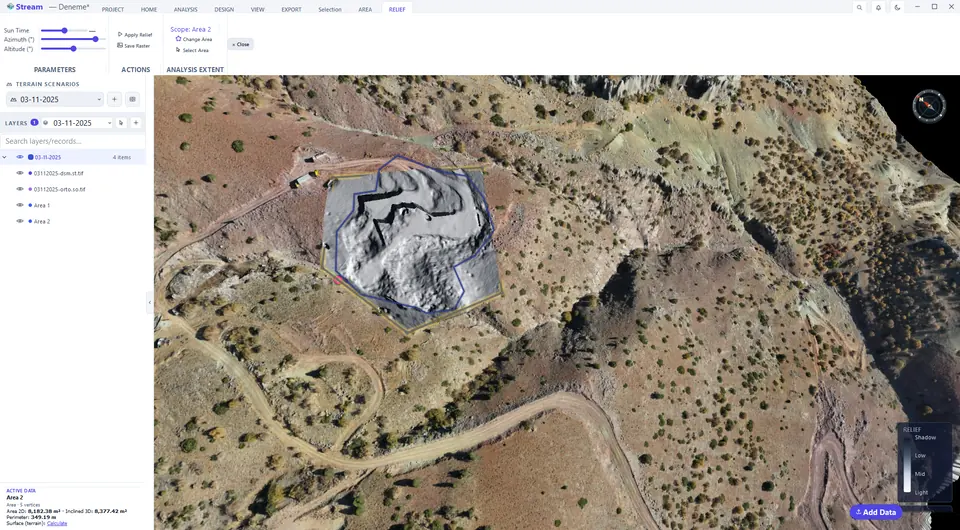
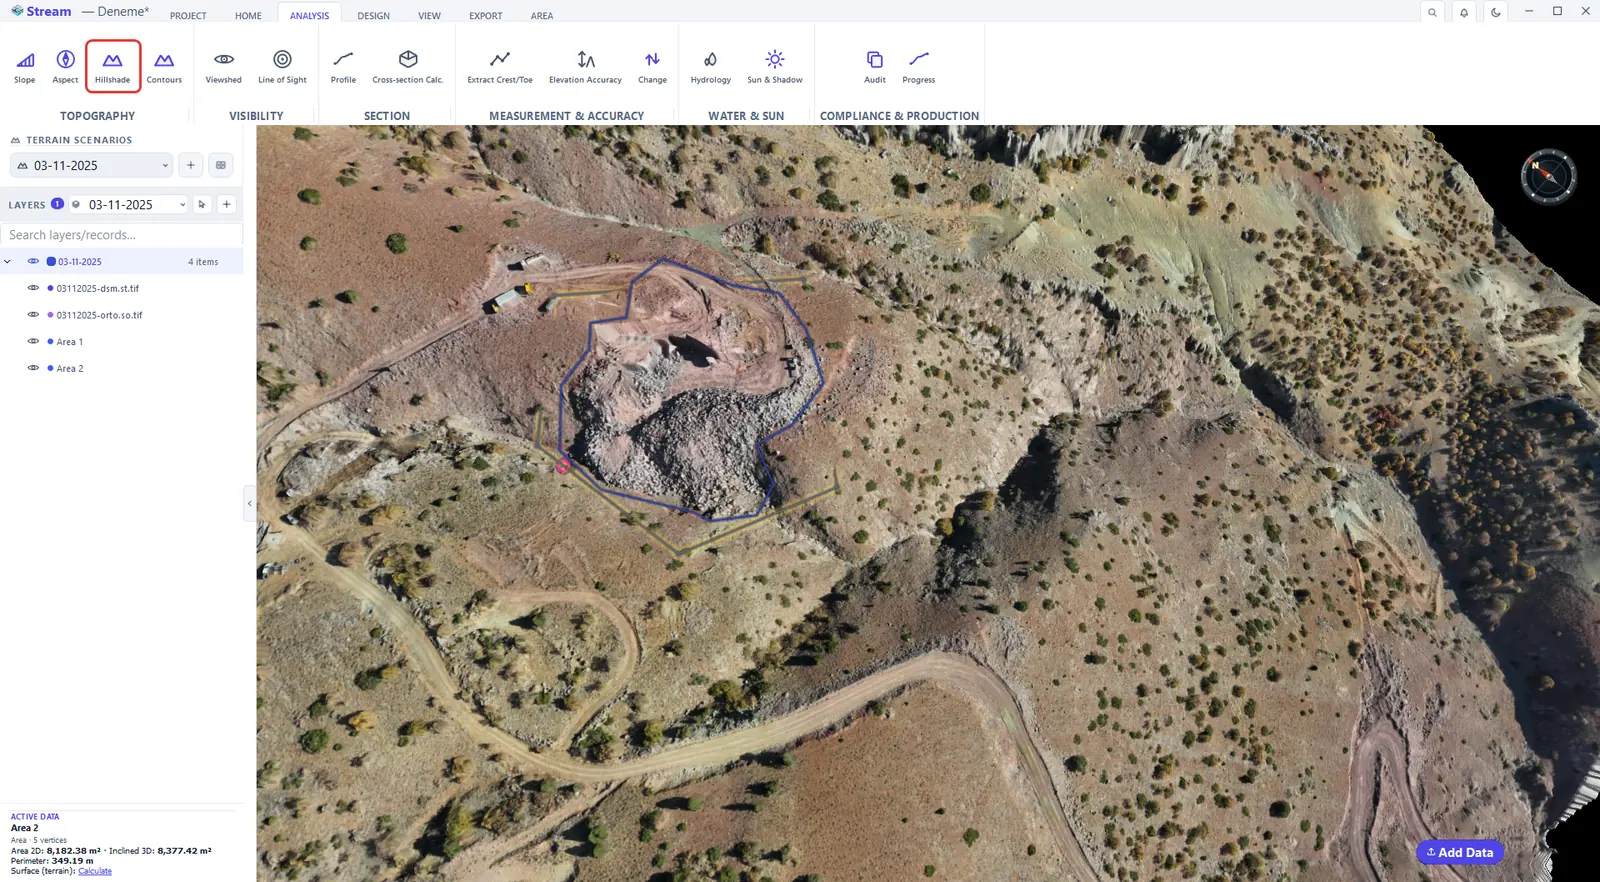
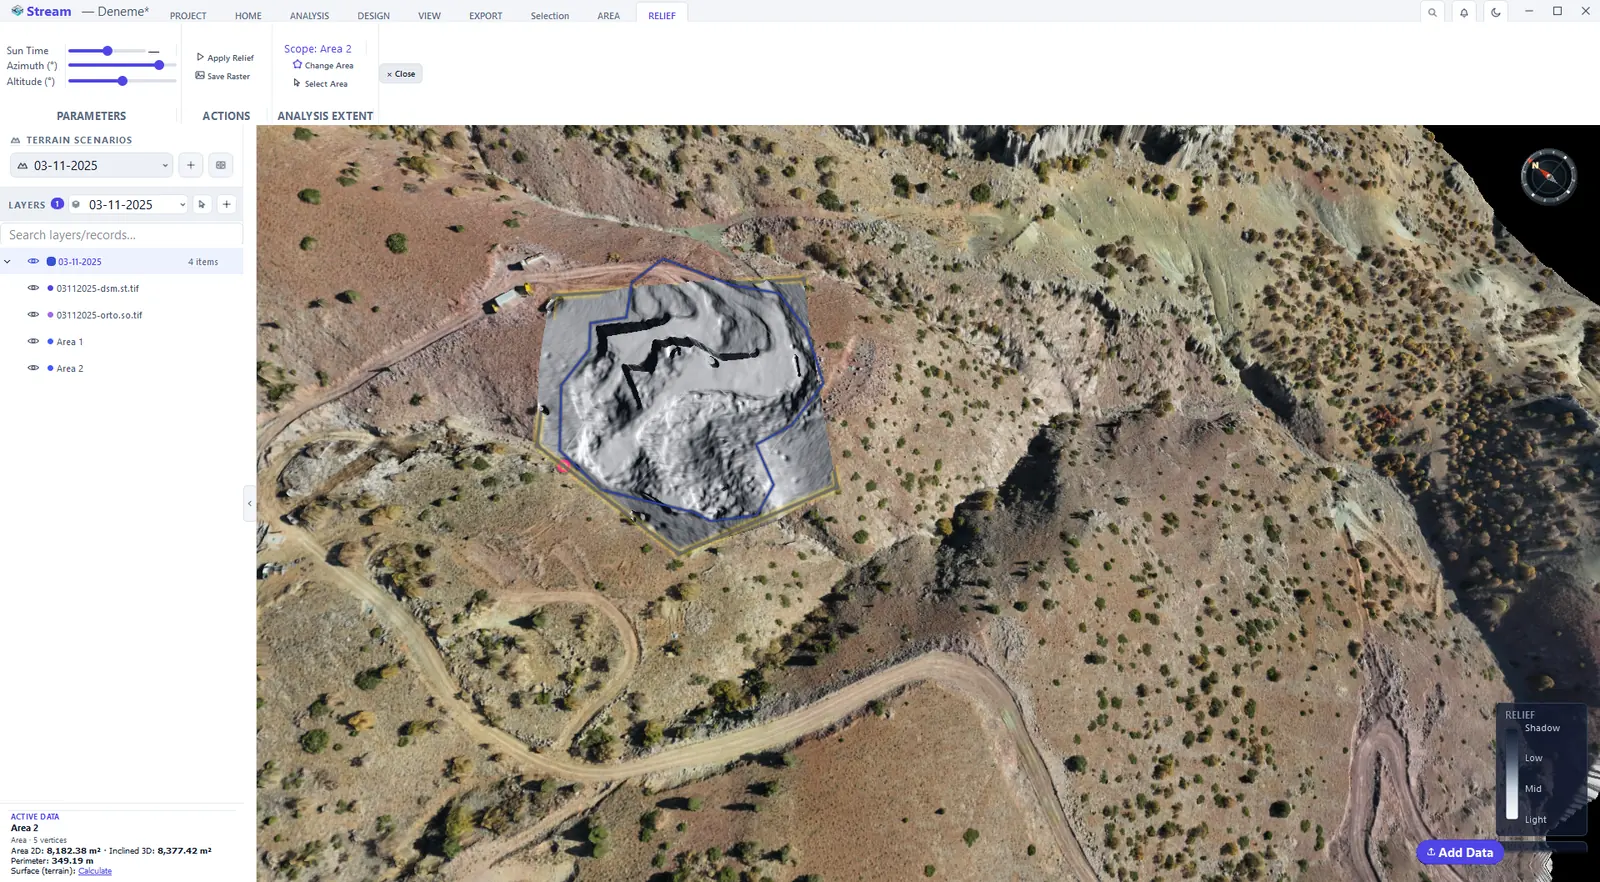
Hillshade lights the relief from a direction you choose. Drag Sun Time, or set Azimuth and Altitude directly; Apply Relief keeps the result and Save Raster writes it as an image.
Press Hillshade on the Analysis tab.
Shaded relief of the terrain.
Viewshed
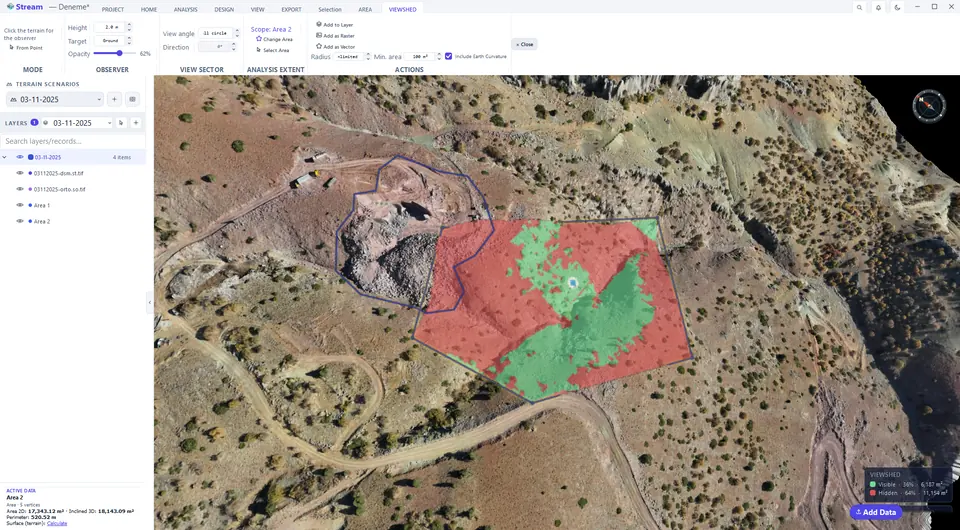
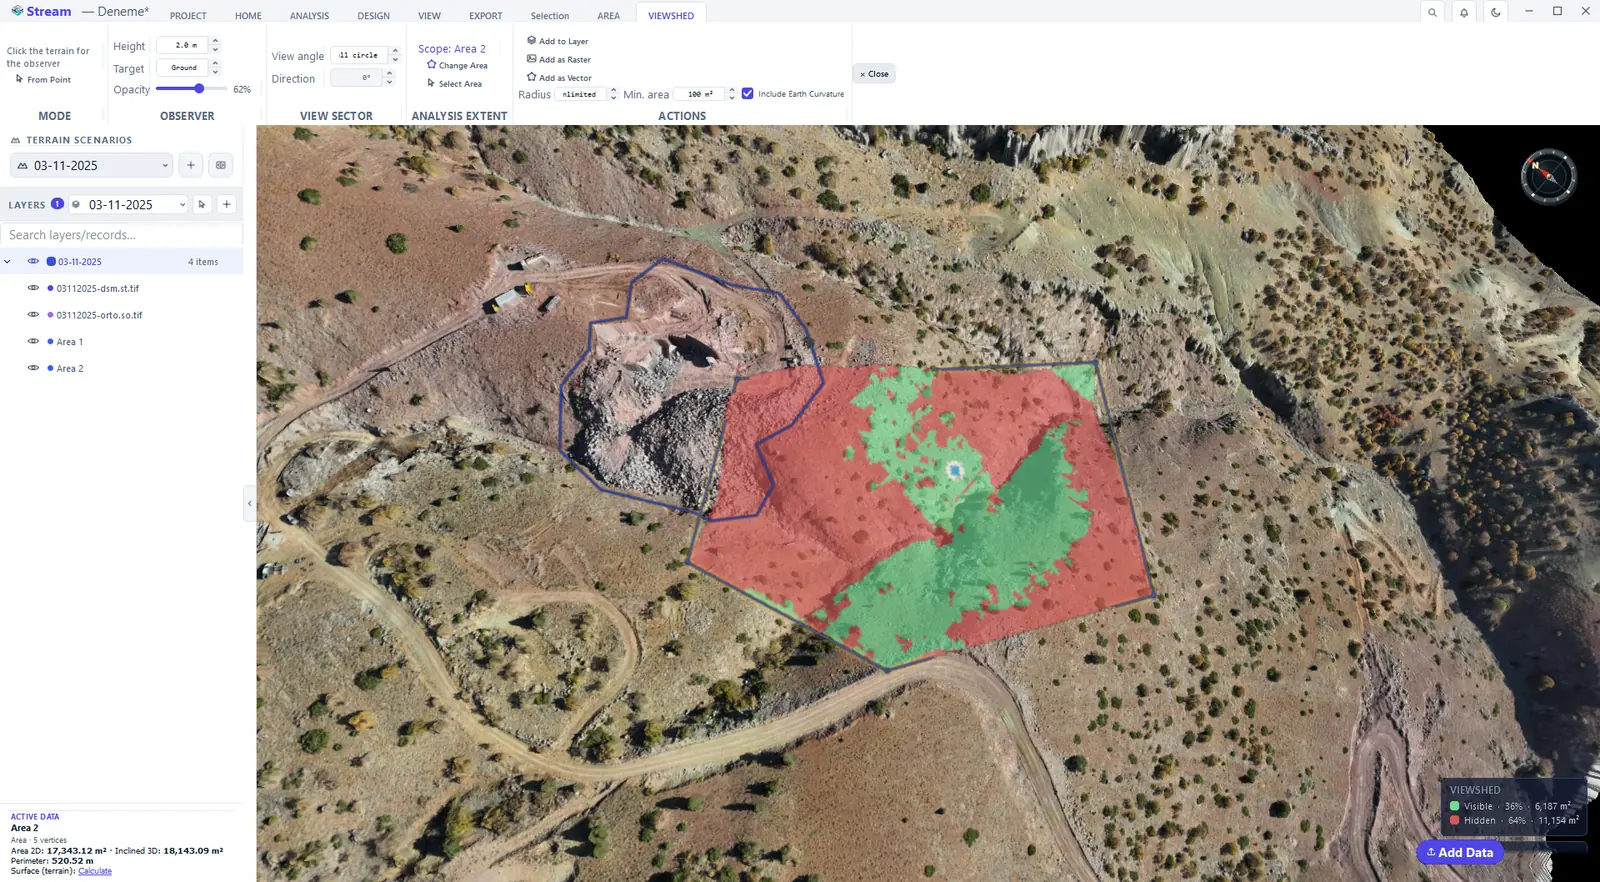
Viewshed answers "what can be seen from here?" Select an area, click ANALYSIS ▸ VISIBILITY ▸ Viewshed, then click the terrain where the observer stands. Visible ground is painted green, hidden ground red. Height is the observer's eye height; Radius limits the sight distance (unlimited by default); View angle and Direction restrict the view to a sector; Include Earth Curvature is on by default.
Viewshed result.
Line of sight
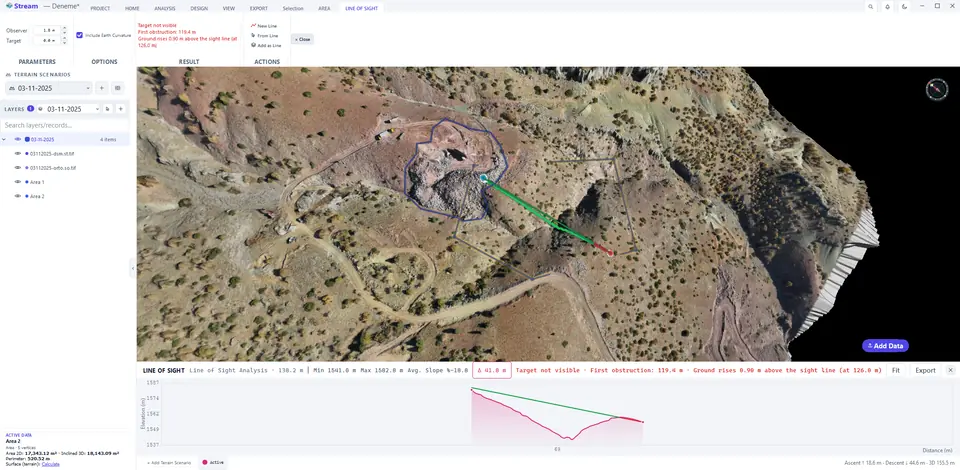
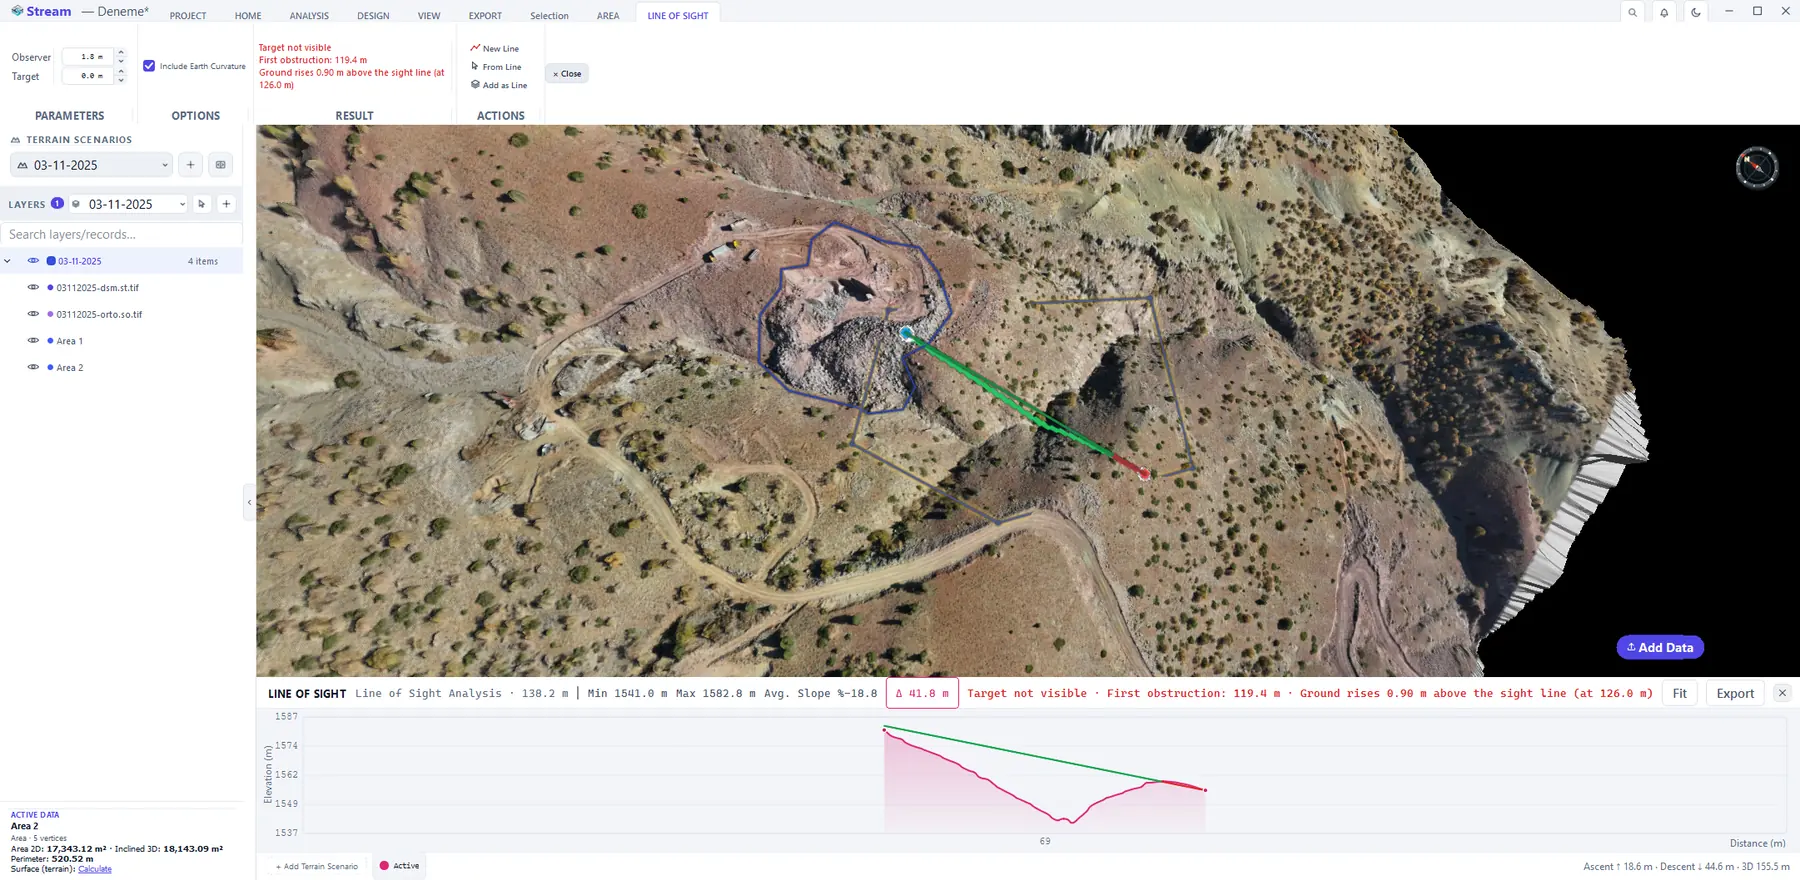
Line of Sight tests a single sight line between two points. Click ANALYSIS ▸ VISIBILITY ▸ Line of Sight, press New Line, then click the observer and the target. The line is drawn green where the target is visible and red behind the first obstruction. The result panel states whether the target is visible, where the first obstruction is and how far the ground rises above the sight line, and the profile at the bottom shows the terrain under the line with the sight line on top.
Line of sight between two points.
Elevation profile
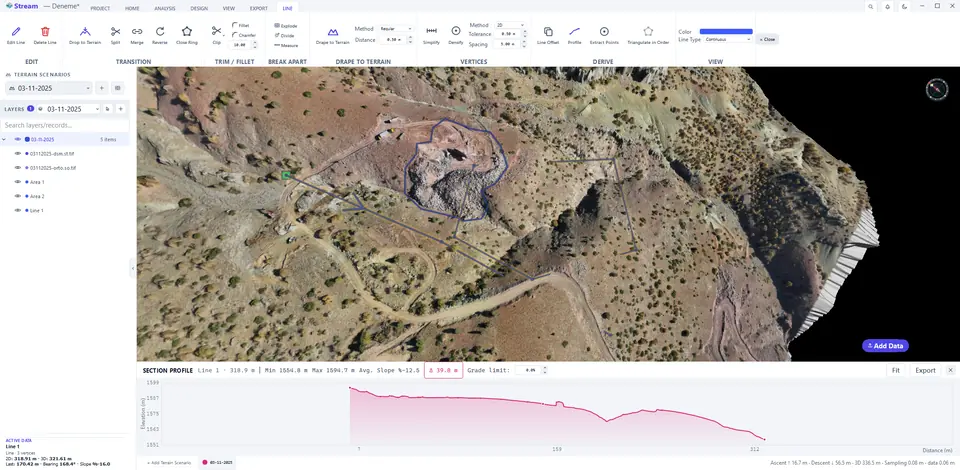
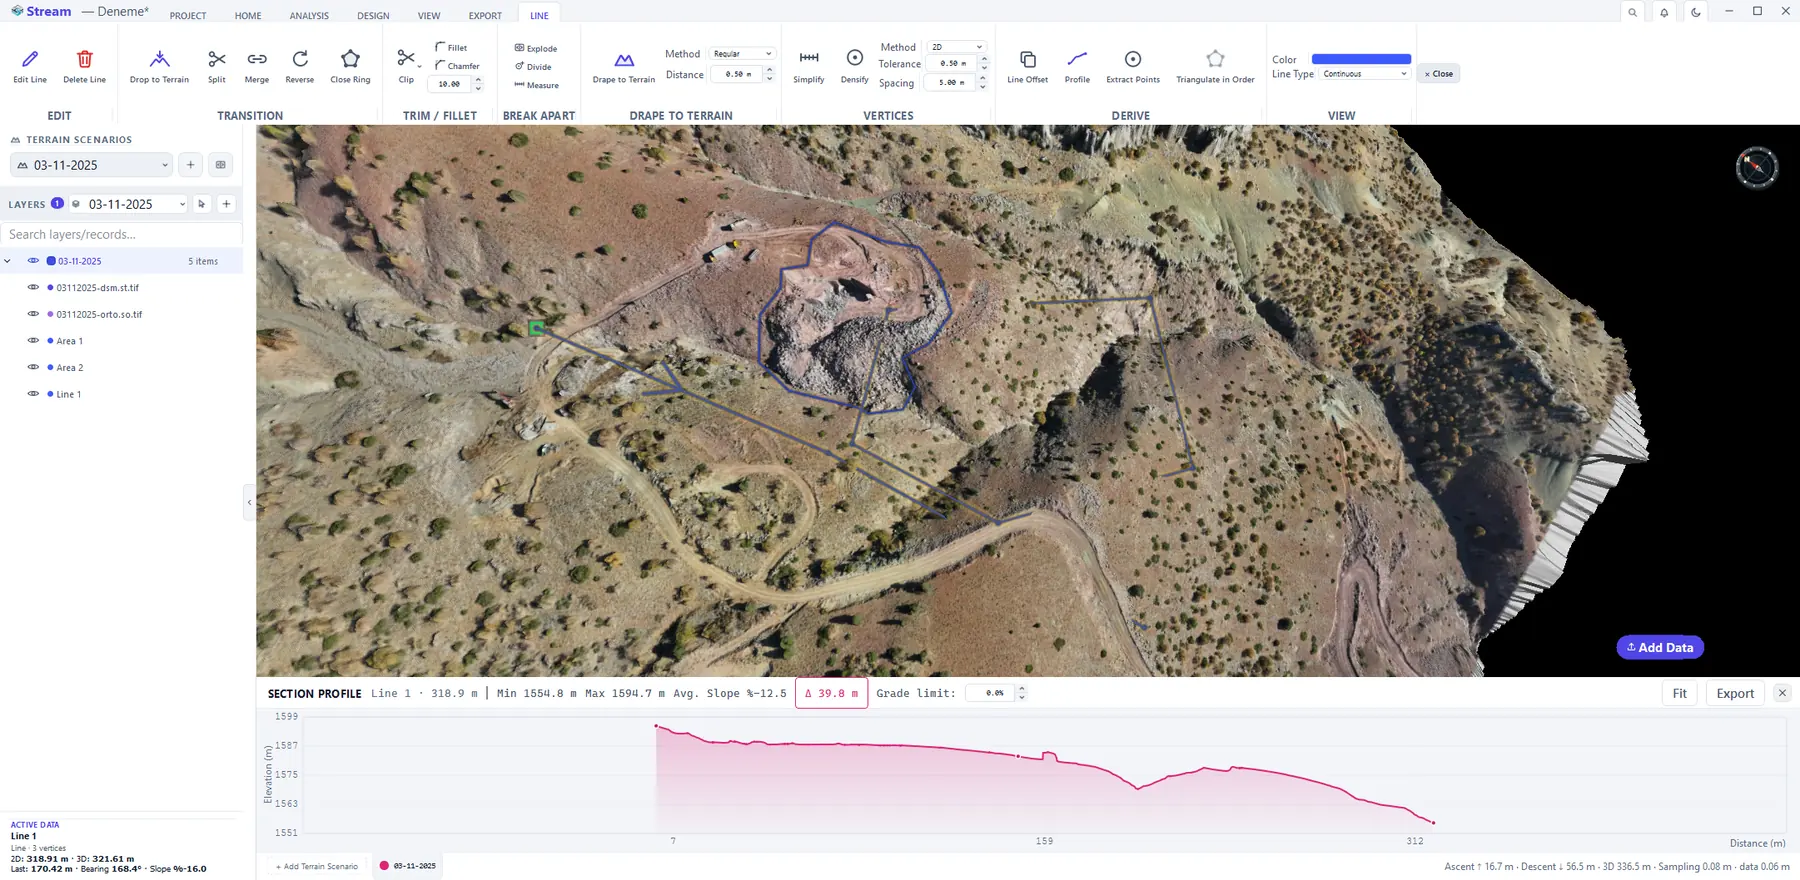
Click ANALYSIS ▸ SECTION ▸ Profile and draw the section line on the terrain; right-click to finish. The SECTION PROFILE panel opens under the view: length, lowest and highest elevation, average slope and elevation difference in the header; total ascent and descent at the bottom. + Add Terrain Scenario overlays the same section from another scenario — the quickest way to see what changed between two surveys along a line. Export writes the profile out; Fit resets the chart zoom.
Elevation profile along a line.
Hydrology
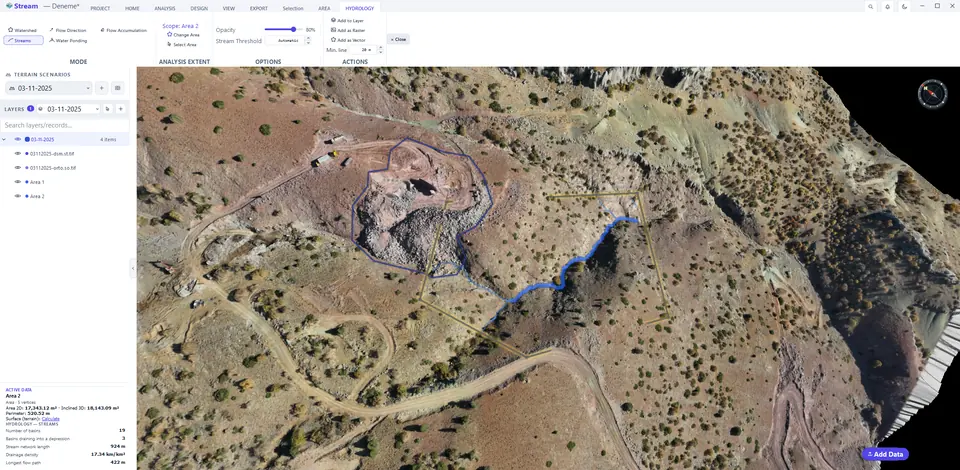
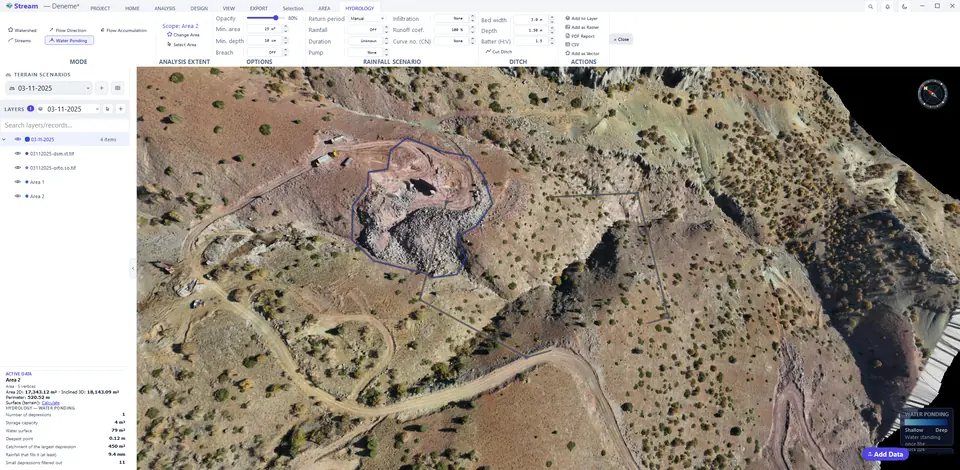
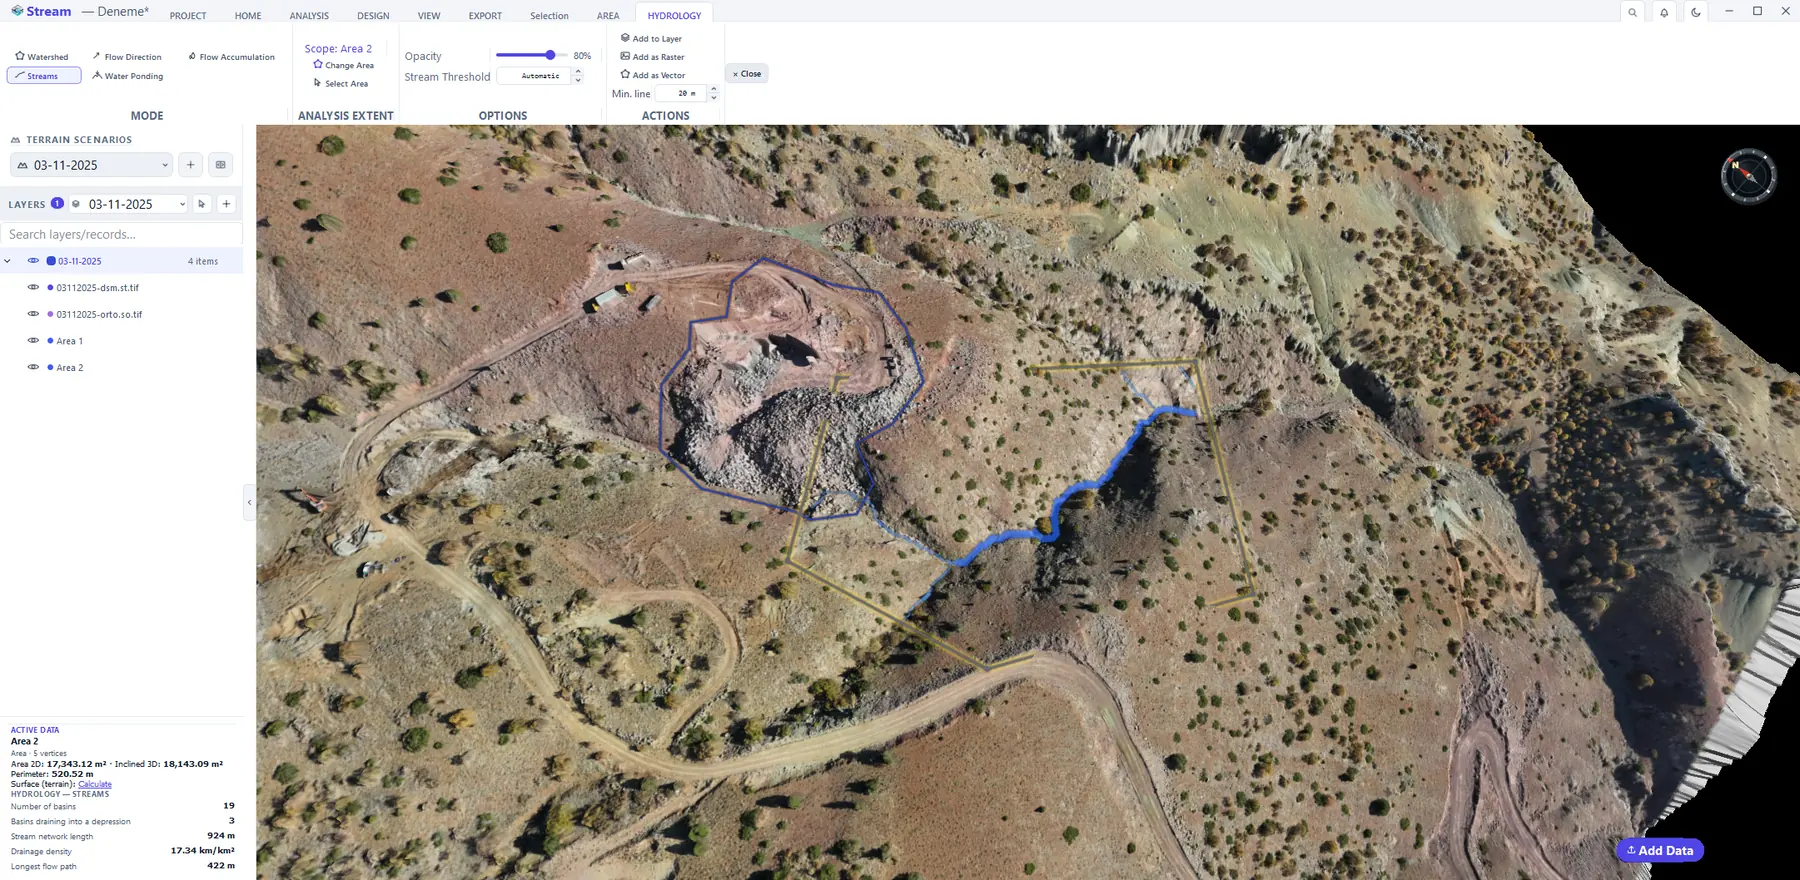
Select an area and click ANALYSIS ▸ WATER & SUN ▸ Hydrology. The HYDROLOGY tab opens in Watershed mode: each drainage basin gets its own colour, and the card at the bottom-left counts the basins and reports the stream length, the drainage density and the longest flow path. Switch the mode to read the same surface differently:
Hydrology controls on the ribbon.

Stream network and basins.
Watershed from an outlet.
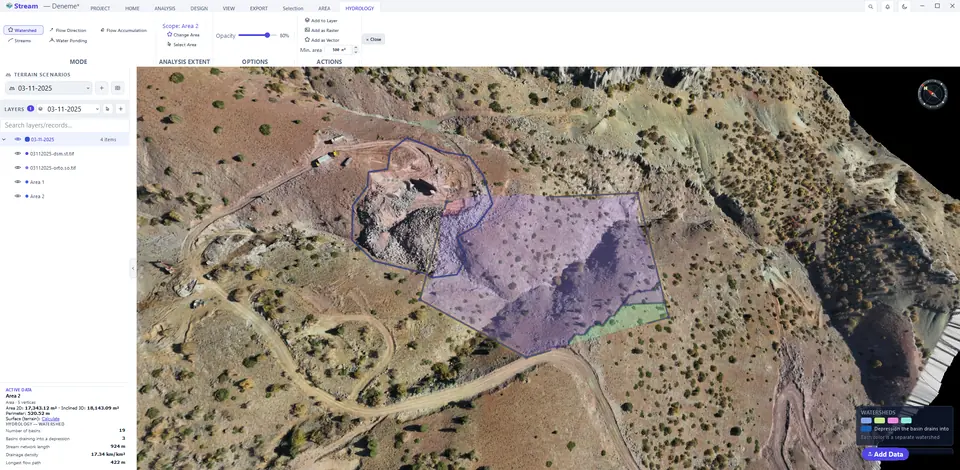
Water ponding depressions.
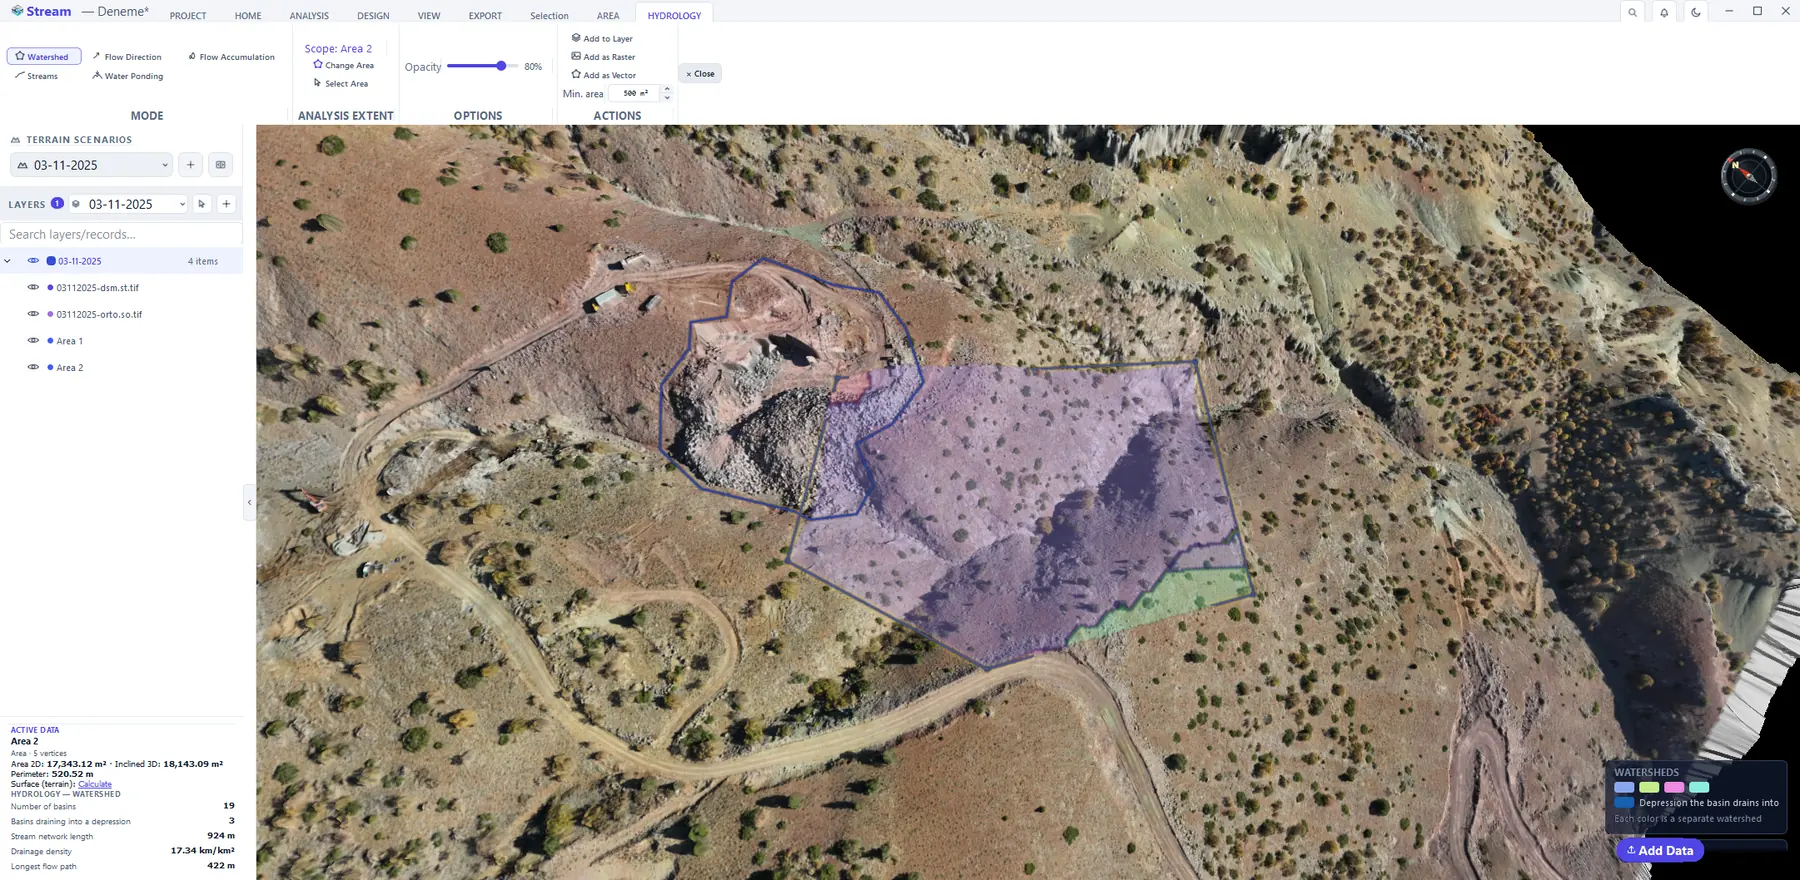
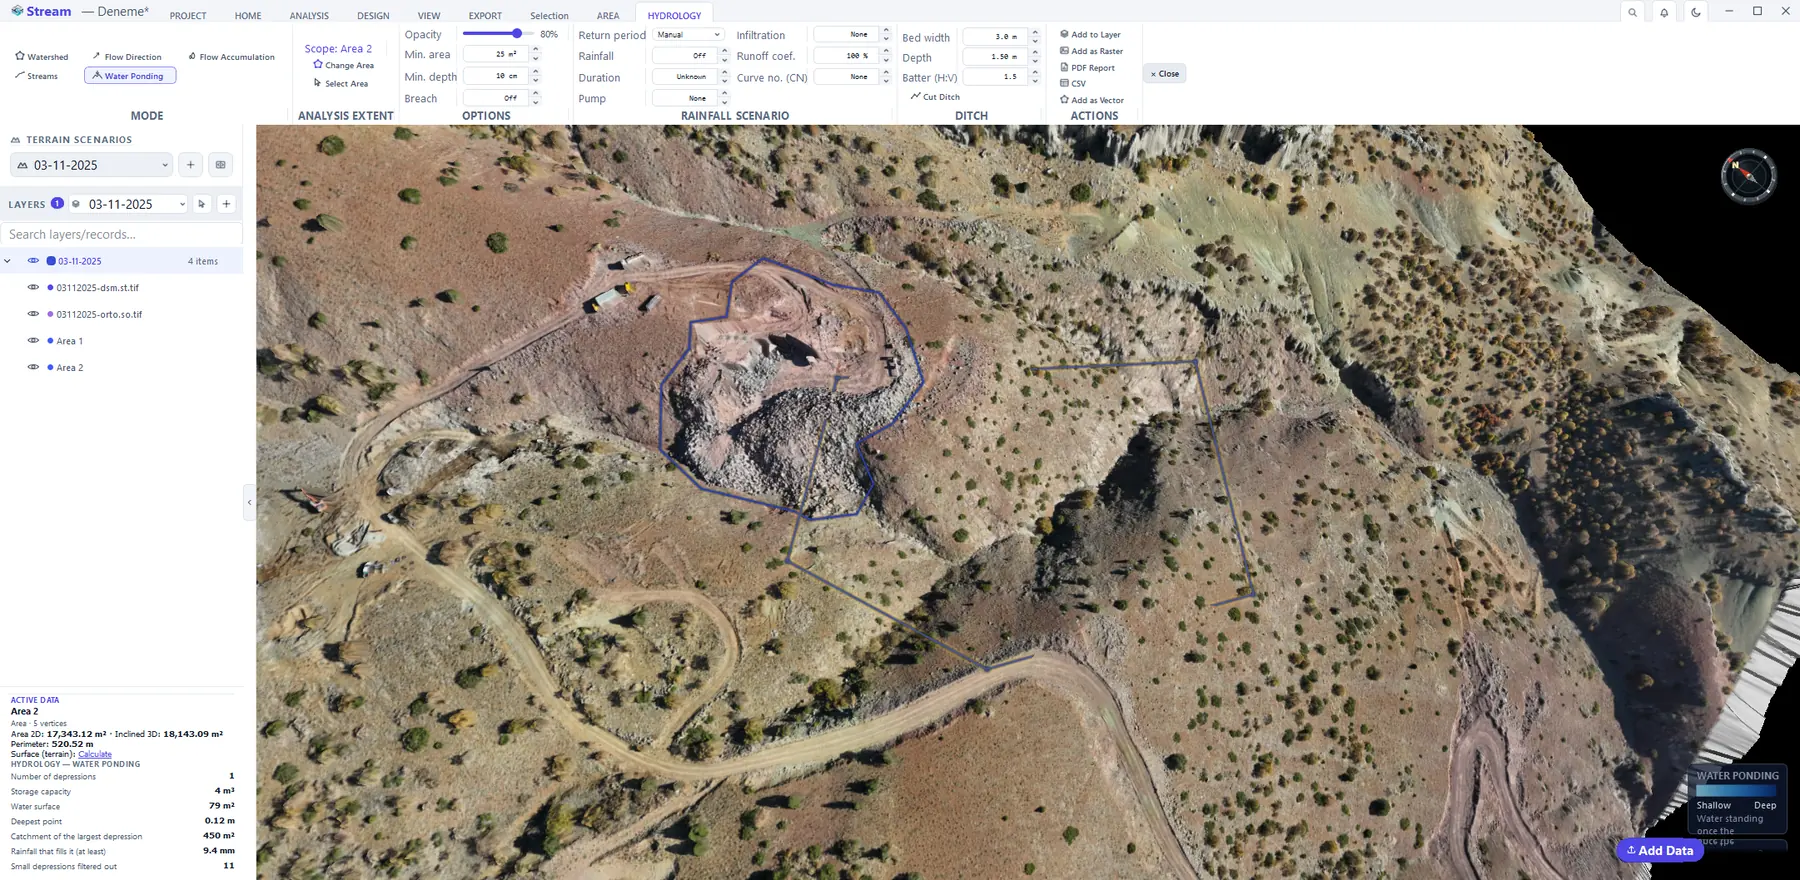
- Watershed — drainage basins; click the terrain to get the catchment draining to that point.
- Flow Direction — the steepest descent direction of every cell.
- Flow Accumulation — how much upstream area drains through each cell.
- Streams — the stream network; Stream Threshold sets how much upstream area makes a stream (automatic by default).
- Water Ponding — the closed depressions where water collects, with their depth and storage volume. Enter a Rainfall or a Return period to see which depressions fill.
Sun and shadow
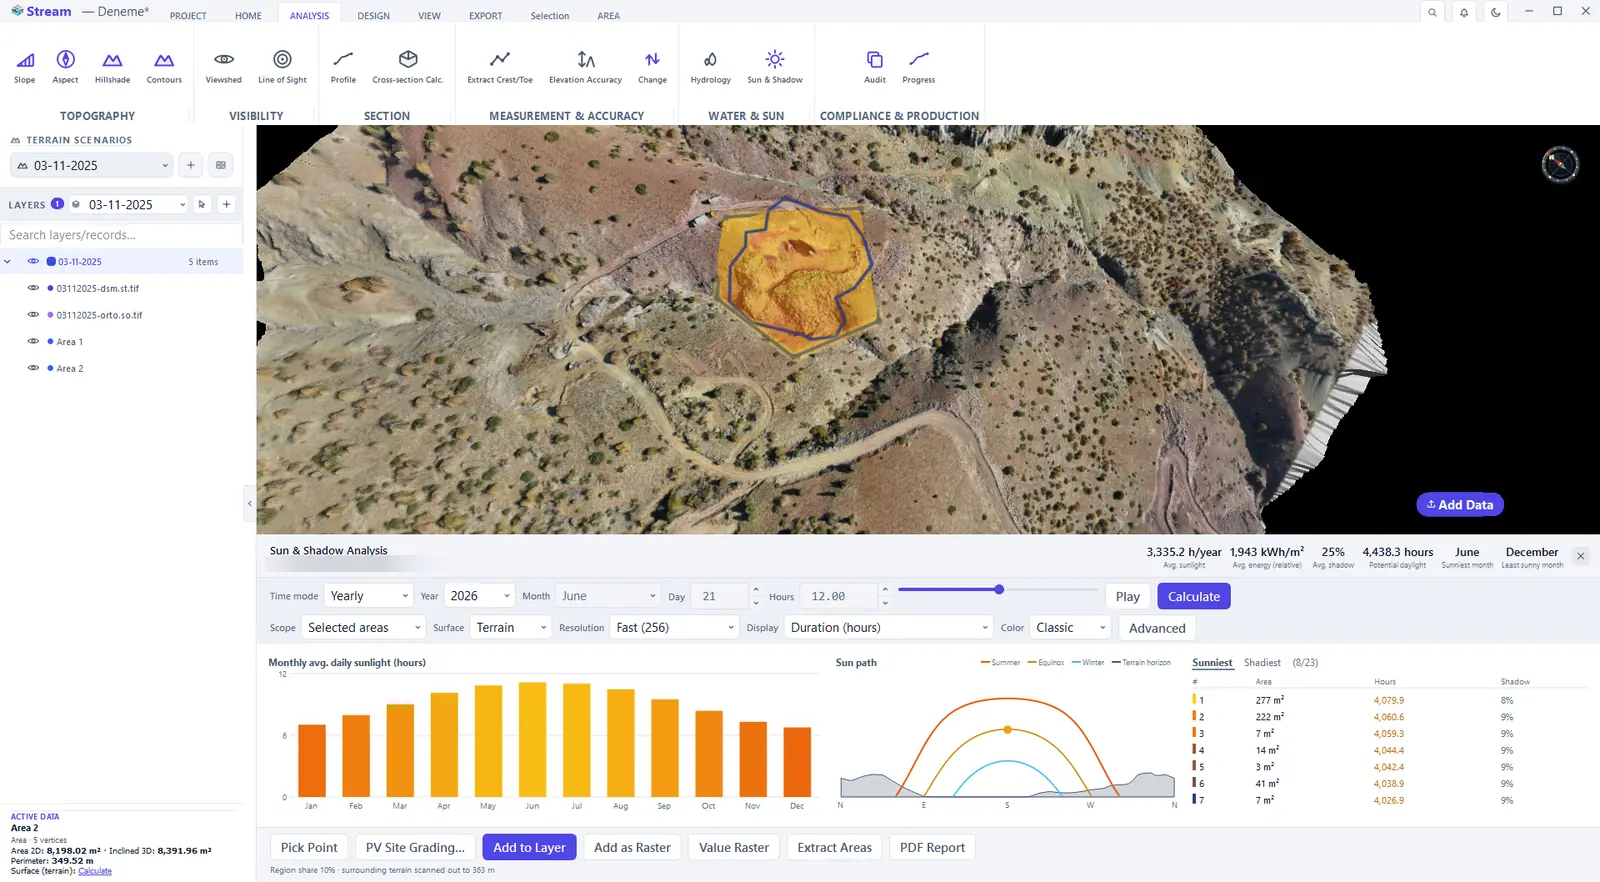
Sun & Shadow computes how many hours of sun each part of the site receives, including the shadow thrown by the surrounding hills. Select one or more areas and click ANALYSIS ▸ WATER & SUN ▸ Sun & Shadow; the panel opens under the view.
Sun and Shadow panel.
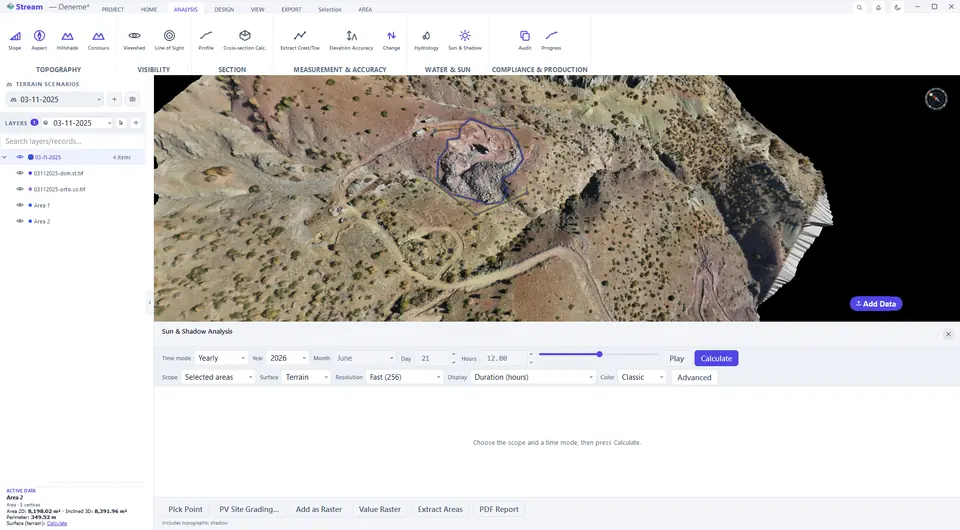
Shadows at the chosen time.
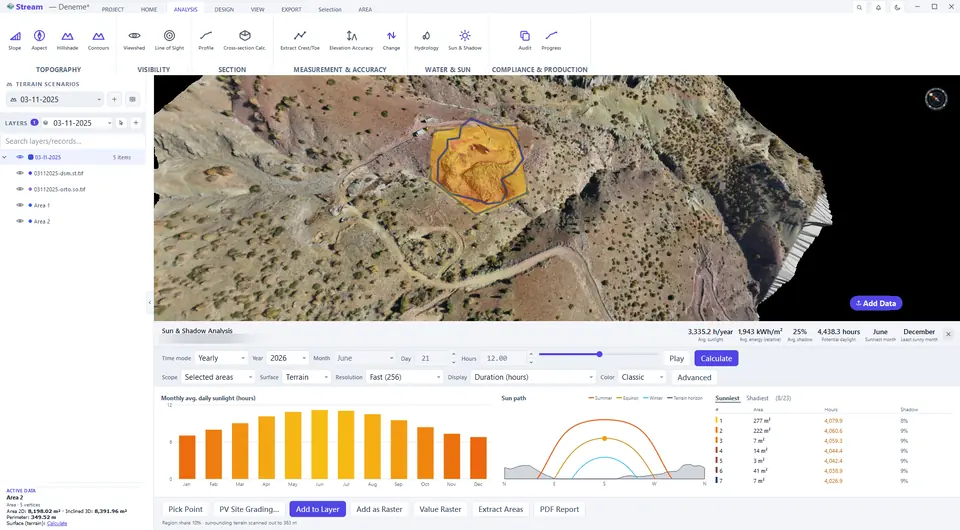
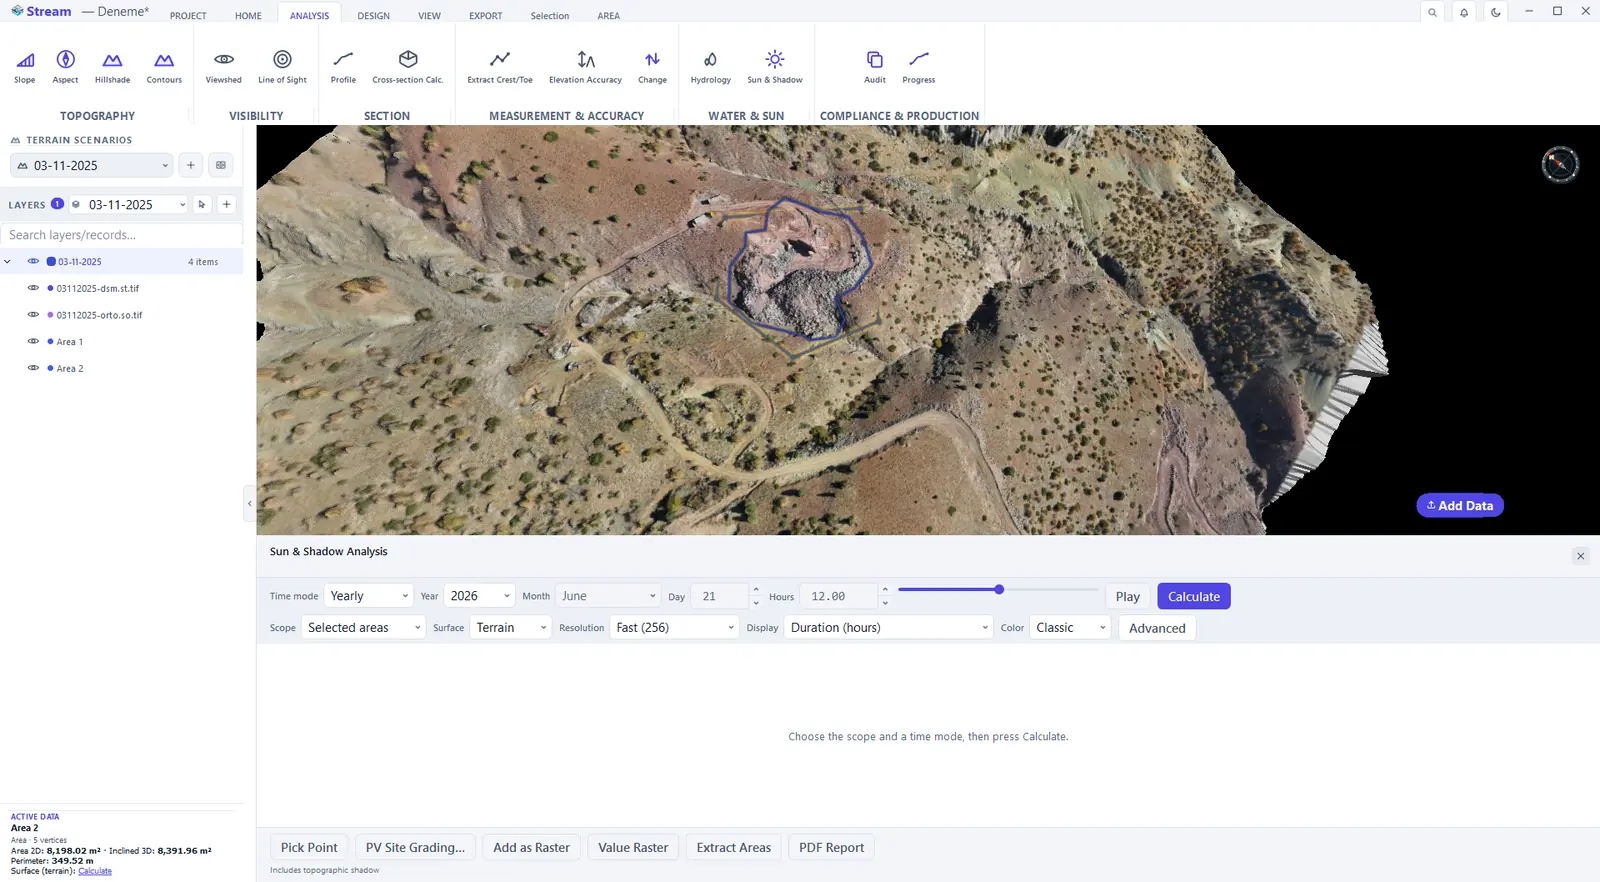
- Choose the Time mode: Instant (one day and hour), Daily, Monthly or Yearly. Set Scope to Selected areas or the whole terrain and pick a Resolution.
- Press Calculate.
- Read the result: the header gives the average sunlight, energy and shadow share; the bar chart shows the average daily sunlight per month; Sun path shows the summer, equinox and winter arcs above the terrain horizon; the table lists the sunniest and shadiest regions — click a row and the map goes there.
- Display switches the map between duration, energy and shadow ratio without recomputing. Pick Point shows the first and last sun time of a point you click.
- Keep the result with Add to Layer, Add as Raster, Value Raster (a GeoTIFF with the numbers), Extract Areas or PDF Report.
Next: Volumes and change detection.
Related features
What each capability does, which formats it reads and writes, and answers to common questions: